


Share this
What if you could see real-time power generation and transmission data updated every 60 seconds? With Live Power, you can.
Live Power covers all seven US Independent System Operators (ISOs) – the California Independent System Operator (CAISO), the Electric Reliability Council of Texas (ERCOT), Midcontinent Independent System Operator (MISO), New England ISO (NE-ISO), New York Independent System Operator (NYISO), Pennsylvania-New Jersey-Maryland ISO (PJM), and the Southwest Power Pool (SPP).
Across the ISOs, Live Power monitors more than 500 GW of generation and transmission. See our coverage across the US in the map below.
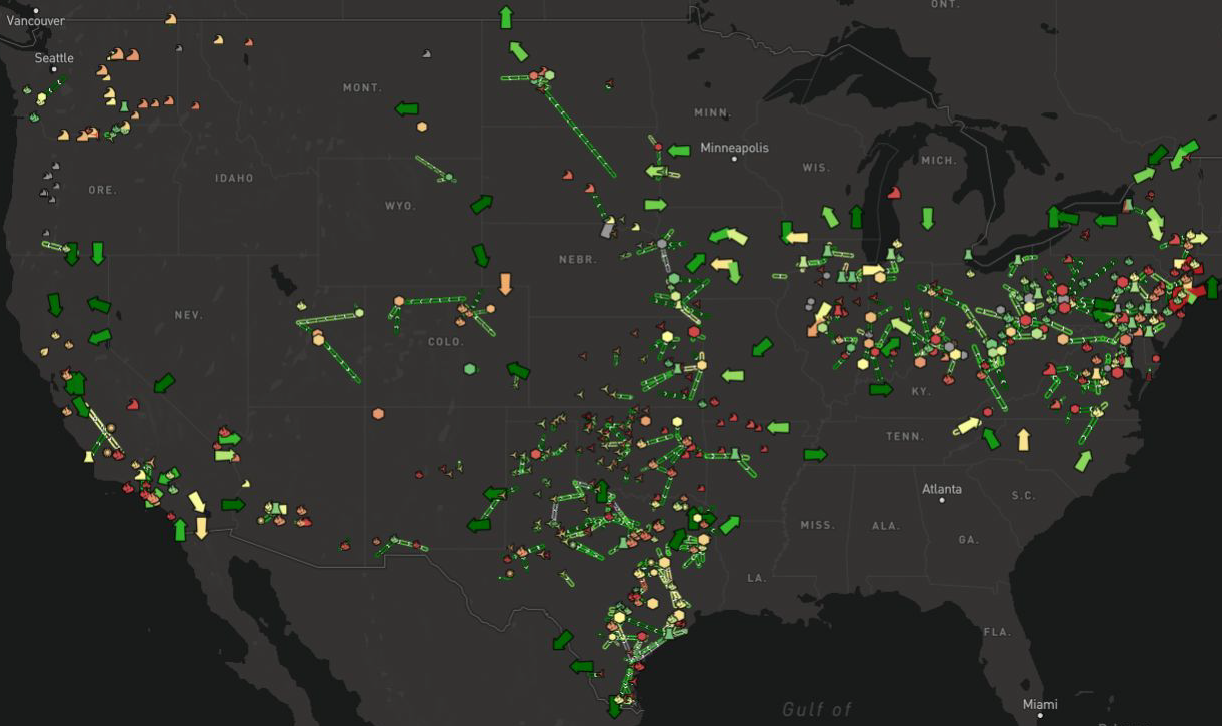
Source: Yes Energy. Live Power sensor locations
We’re committed to continuous improvement. In 2024, Live Power released 18 new facilities.
Our Field Team
Our robust team regularly services our equipment for monitoring generation, transmission and load. We monitor over 2,000 transmission lines and over 800 facilities – and have fun while we’re doing it.

Source: Yes Energy. Our field team.
Our Monitors
Our monitors are inconspicuous but mighty. The small box, pole, and solar panel pictured below allow our customers to see generation and transmission data in real time, including whether a facility is on or offline and how much power it’s generating.
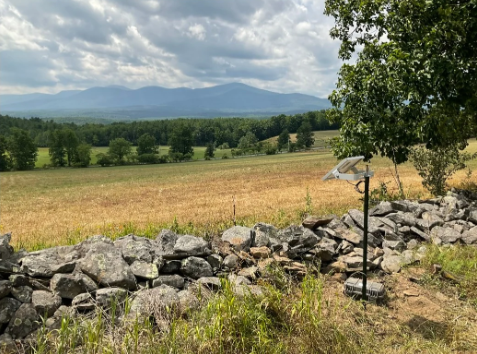
Source: Yes Energy. A Live Power sensor
How Do We Choose What Facilities to Monitor?
We listen to customers – in 2024, each facility we monitored fulfilled a customer request.
We also pay attention to market-moving trends, such as dips in coal-powered generation.
Who Can Use Live Power Data?
Traders can use Live Power data to make day-ahead and real-time trade decisions. For example, you can use it to bridge the gap between historical power market prices and forecasts. Or you can use it to enhance your power market congestion analysis.
During times of extreme weather like Winter Storm Heather, it provides more accurate supply and demand market data.
It also allows you to spot industry trends faster and understand their origins, such as when Atlas Power sparked grid congestion.
Prepare for the Unexpected with Live Power
Stay ahead of market moves with real-time visibility into the rapidly changing grid.
Live Power monitoring data is fully integrated with Yes Energy’s industry-leading data tools/services, allowing traders, utilities, and power market investors to:
- See online/offline dispatchable power generation capacity and unit-by-unit output to track day-ahead unit commitment and evaluate day-ahead to real-time spreads
- See inter-zone transmission flow to spot real-time congestion
- See renewable production on the geographic “edges” of the market, a leading indication of changes in ISO-wide fleet performance
- See sudden plant and line outages to explain unexpected scarcity pricing
- See long-term views of power transmission flows to forecast grid congestion in the future
- Capture today’s grid flows to calibrate models daily with the latest plant/line data.
Want to see how Live Power’s better data, better delivery, and better direction can help your organization?
Request a trial of Live Power.

 About the author: Amber Armentrout is the vice president of operations for Live Power, Yes Energy’s premium grid-monitoring service. She is an enthusiastic leader striving to provide the most accurate real-time generation and transmission data to energy traders. She graduated from the University of Colorado with a Bachelor of Arts in mathematics and economics. She enjoys running and spending time with her family.
