


Share this
by Alex Bennitt
Crypto mining facilities are part of a growing category of large flexible loads (LFL) connecting to the grid at an accelerating pace. This leads toward more constraints, greater scrutiny of market-to-market coordination, and in some cases, litigation.
In the case of the Southwest Power Pool (SPP) Independent System Operator (ISO), a new crypto mining facility, Atlas Power Data Center, significantly contributed to the highest day-ahead and real-time constraint for 2023 – Charlie Creek to Watford 230 KV. The Charlie Creek constraint bound at such extreme levels (about three times the next highest) that it was also the largest congestion cost in the Midcontinent Independent System Operator (MISO) for 2023 because of Charlie Creek’s inclusion in market-to-market (M2M) coordination between SPP and MISO regarding shared constraints.
The result? Pending litigation surrounding Charlie Creek’s inclusion in M2M coordination and litigation surrounding Atlas Power Data Center’s load expansion – to the point of attempting to cut power to the facility.
Crypto load data has been hard to come by and even litigated when the Energy Information Administration (EIA) attempted to collect crypto mining power consumption data in February. Yes Energy’s Live Power® product happens to already have the data on Atlas Power, which provides significant insight into how the facility operates and drives congestion. Atlas Power is one facility encompassed in Live Power’s growing LFL coverage.
Using Live Power data, we can delve into an in-depth analysis of the Charlie Creek constraint, Atlas Power Data Center, and the local Pioneer Generation Station, plus transmission data.
Charlie Creek to Watford Is the Top RT/DA Constraint in SPP and MISO
Charlie Creek to Watford 230 KV is the highest-priced real-time (RT) and day-ahead (DA) constraint in 2023 for SPP. It leads by a wide margin, with the real-time shadow price totaling $1.1 million across 35% of hours, about three times the next highest binding constraint (see chart below).
In the day-ahead market, the constraint appeared in 68% of hours, twice real time. However, it was under-modeled in pricing, with the shadow price totaling $0.9 million.
Charlie Creek to Watford bound at such extreme levels that it was also the highest-priced real-time and day-ahead constraint in MISO.
This resulted in litigation concerning market-to-market (M2M) coordination between SPP and MISO – specifically the inclusion of the Charlie Creek constraint in M2M when MISO can’t easily respond to and alleviate the constraint.
The extreme constraint levels stem from two factors.
- The constraint is entirely load-driven.
- The constraint location is at the far north edge of SPP, near the boundary of the eastern/western interconnection.
This makes for a constraint with low amounts of generation on the positive side of the constraint that can respond to and alleviate the condition.
Top four SPP real-time and day-ahead constraints for 2023

Note: 2023 SPP constraint info, including shift factors, for 2023 can be found in Yes Energy’s Constraint Summary tool within PowerSignals: 2023 real-time constraints; 2023 day-ahead constraints.
The Constraint Started Binding at High Levels When the Crypto Facility Launched
Behind the constraint is localized load growth outside of Williston, North Dakota, driven specifically by a large load at a new crypto mining facility called Atlas Power Data Center, which Live Power monitors on a 60-second basis. Both the constraint (Charlie Creek to Watford 230 KV) and contingency (Charlie Creek to Patent Gate 345 KV) are on lines bringing power up to Williston. The contingency terminates one segment after Patent Gate at the Judson Substation, which Atlas Power connects into.
Using the Constraint Summary module in Yes Energy's PowerSignals® offering, we can see extreme binding levels on Charlie Creek to Watford in the second to fourth quarters of 2023 when Atlas Power Data Center was operating at its full phase-one load (see chart above). Elevated binding levels on Charlie Creek to Watford started when Atlas Power was under construction, yet potentially drew partial power during the second to fourth quarters of 2022.
The facility has plans for two additional phases that will bring total power consumption near 700 MW.
Quarterly shadow price on Charlie Creek to Watford 230 KV from Q1 2019 through Q4 2023, $/MWh
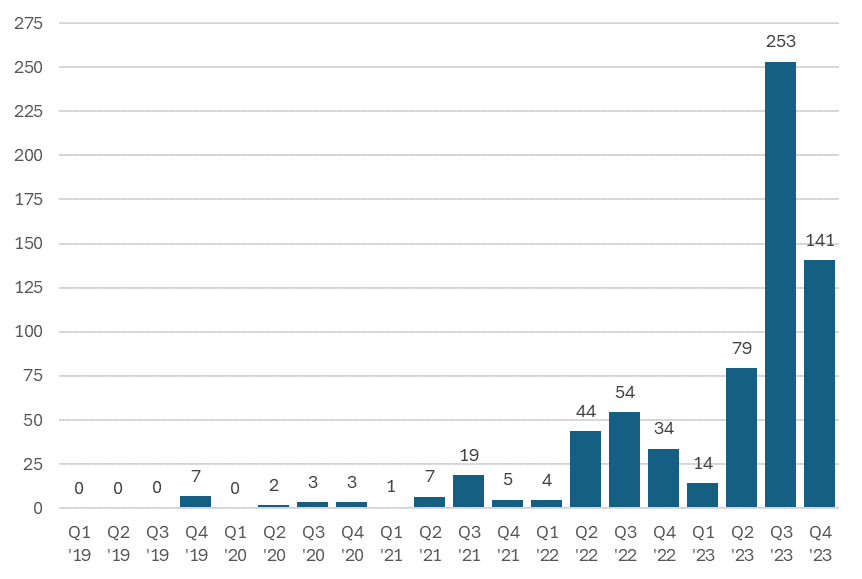
Source: Yes Energy’s constraint data
Day-Ahead Prices Impact Atlas Power Data Center
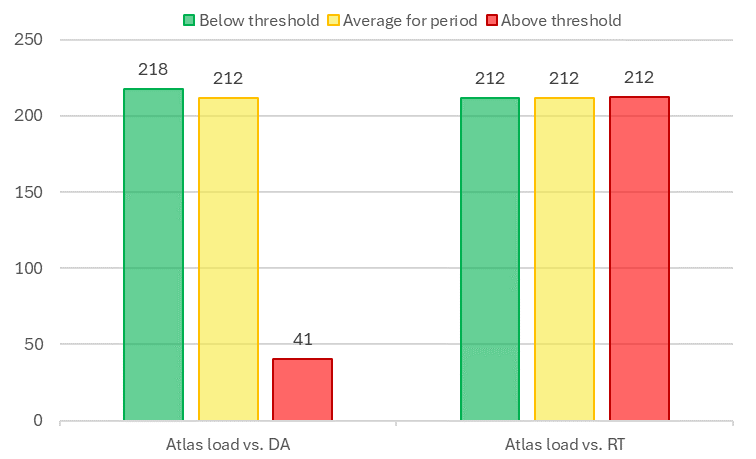
Atlas Power is a significant contributor to the Charlie Creek to Watford constraint, and it's likely to continue given little to no response in operations during periods of high, constraint-driven, real-time pricing. Live Power data on Atlas Power shows that the facility doesn’t curtail operations even with high real-time pricing (see graph below).
This is in stark contrast with Live Power monitored Rockdale Crypto in the Electric Reliability Council of Texas (ERCOT), which significantly curtails operations at certain real-time price levels.
Atlas Power appears to significantly respond to day-ahead prices at certain levels (see graph below), which could be related to the facility’s power contract with Mountrail-Williams Electric Cooperative (MWEC). Transaction data for the facility and Mountrail-Williams Electric are not readily available.
Hourly Live Power monitored Atlas Power load versus real-time and day-ahead prices, MW
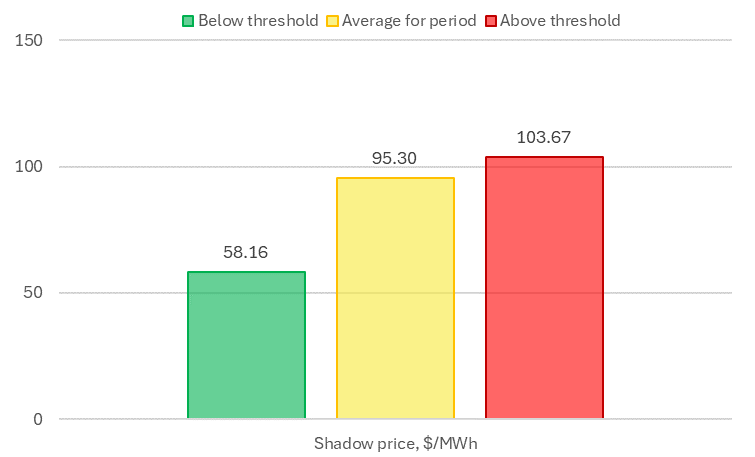
When Atlas Power Load Drops, Binding on Charlie Creek to Watford Is Less Likely
Due to the Charlie Creek constraint being under-modeled in the day-ahead market, day-ahead prices often don’t reach high enough levels to cause Atlas Power curtailment. Therefore, the crypto mining facility ran at full operation levels for most of the three-month period for which Live Power has Atlas Power data.
The facility drives real-time congestion so much that even minor reductions in facility operations caused significantly lower real-time shadow prices. When Atlas Power load dropped below a certain threshold, real-time shadow prices averaged $58.20/MWh, almost two times (44%) lower than the $103.70/MWh average shadow price in intervals with higher output. For intervals at higher load levels, the facility showed no real-time response, even with shadow prices pinned at $1,500/MWh.
Hourly Live Power monitored Atlas Power load versus shadow price, Dec. 14, 2023, to current, $/MWh
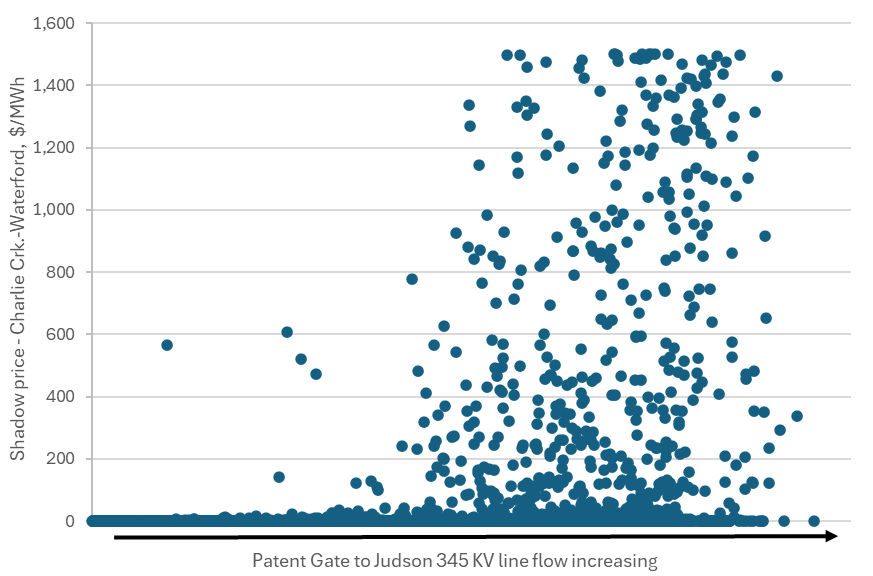
Live Power Line Flow on Patent Gate to Judson Is Highly Correlated with Charlie Creek Shadow Price
While Atlas Power’s load is a major driver of the Charlie Creek constraint, there are still certain flow conditions needed for the constraint to bind. Live Power transmission flow data on Patent Gate to Judson 345 KV shows that when flow across this path reaches a certain level, Charlie Creek to Watford is much more likely to be constrained. This transmission line sits one segment away from the contingency and is highly correlated to flow across the contingency because of limited high-voltage corridors to transport power up to the northwest part of North Dakota.
Live Power transmission line flow (x axis, MW) versus Charlie Creek to Watford shadow price (y axis, $/MWh), October 27, 2023, to current
The Pioneer Generation Facility Can’t Alleviate the Charlie Creek to Watford Constraint
Another factor behind extreme binding levels seen on the Charlie Creek constraint is limited dispatchable generation resources that can respond to elevated real-time and day-ahead prices. Because the constraint is on the edge of the grid, there are only 700 MW of gas-fired resources across three facilities that can respond.
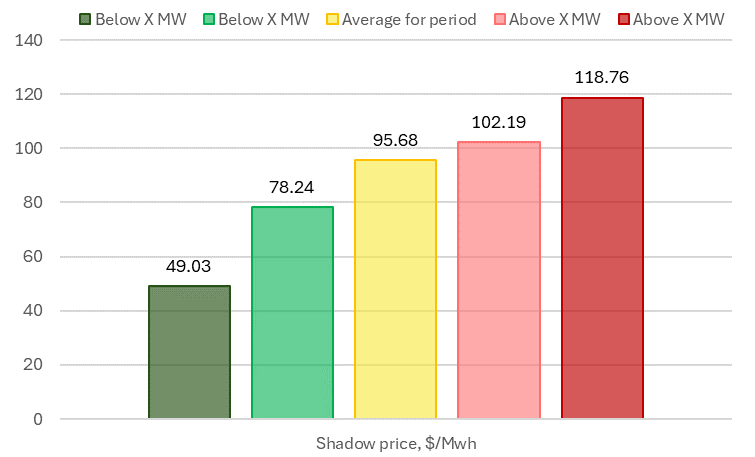
Live Power monitors one of them, 293 MW gas turbine facility Pioneer Generation Station, which sits about five miles away from the Judson Substation. Pioneer has the seventh-highest shift factor associated with the Charlie Creek constraint, 0.38, but the highest for a generation resource because the top six are load-related nodes.
Despite the high shift factor, Live Power data shows that Pioneer has little ability to provide Charlie Creek congestion relief even at full output. When the facility is operating above a certain level, shadow prices average $118.76/MWh, and the highest shadow prices observed across the three-month period occurred when Pioneer generated at a higher output versus a lower output. The facility ran at a high capacity factor against nameplate on average, which is significantly higher than an average gas turbine facility, and a result of elevated pricing from the Charlie Creek constraint.
Live Power monitored Pioneer production level versus shadow price, hourly, December 15, 2023, to current, $/MWh
Change Is Coming But Not for a While
Compared to Atlas Power’s load, Pioneer’s nameplate is enough to cover Atlas operations, but why doesn’t it provide relief? Well, its response effect is limited due to the 115 KV transmission infrastructure around Williston, which Pioneer is connected to. With Atlas Power load projected to grow to 700 MW, congestion seems like it could worsen.
However, Basin Electric is currently working on a 600 MW addition to Pioneer Generation Station and a new 230 KV transmission connection with Canada, which will add another 600 MW of interchange capacity. This interchange capacity would connect into the Tande Substation, which is connected to the Judson substation via 345 KV, and could provide positive side relief.
Development is also underway on a 345 KV line connecting the Pioneer and Judson substation.
For the most up-to-date information tracking these projects, check out our latest Infrastructure Insights Dataset, which has best-in-industry information.
Constraints on Charlie Creek to Watford Disappear in March 2024
After a year of high shadow prices on Charlie Creek to Watford, something changed on March 1, 2024, as the constraint-contingency pair has barely shown up in SPP or MISO. Interestingly enough, a couple of other constraint-contingency pairs did start showing up at low levels on March 1 with contingencies on a new corridor Charlie Creek and Judson dispatchable demand response resource (CHAR_CK PATENT_G + JUDSON DDR).
While we don’t know why the top constraint over the last year saw a major reduction in shadow price, it could be because of changes to M2M constraint modeling, SPP constraint modeling, or low shadow prices in the first quarter.
Conclusion
Atlas Power’s crypto mining power consumption is projected to grow to 700 MW across two additional phases, which may indicate that Charlie Creek congestion costs will trend higher. However, changes are coming but not for a while. For example, 600 MW capacity additions at Pioneer and 600 MW of interchange capacity with Canada could provide congestion relief. We track both of these in Yes Energy’s Infrastructure Insights Dataset.
With changes on the horizon across multiple key drivers of the Charlie Creek congestion dynamic, the future price implications are unclear. Throughout the changing dynamic, Live Power 60-second data on Atlas Power will continue to provide key details on facility operations to SPP and MISO subscribers.
Delve further into Live Power’s coast-to-coast coverage and how it can help you with your market analysis workflow.
Do you have a facility you’d like to see monitored? Contact lpfundamentals@yesenergy.com. Live Power currently monitors 67% of every customer request we’ve received! We’d love to evaluate facility feasibility and incorporate it into our coverage.
If you want to learn more about this topic, watch our on-demand webinar, What You Need to Know About Crypto Mining Facilities' Impact on the Grid.
 About the author: Alex Bennitt is the product manager for Live Power and partner content integration at Yes Energy, where he utilizes a seven-year background in market fundamentals and Live Power operations to help steer product direction. In his free time, Alex is an avid skier who chases snow almost year-round.
