


Share this
Live Power® delivers unparalleled, actionable insights into the supply dynamics across all seven US Independent System Operators (ISOs). Our patented monitoring technology delivers 60-second power plant production and transmission line flow data to help you stay ahead of market developments.
In this blog, we highlight ways you can use Live Power to leverage your market analysis workflow.
Get US Coast-to-Coast Coverage
In May 2023, Live Power achieved a significant milestone with the successful launch of our California Independent System Operator (CAISO) and Western Electricity Coordinating Council (WECC) product.
This event marked the culmination of a seven-year endeavor to achieve complete coast-to-coast coverage in the US. The launch resulted in an additional 87 gigawatts (GWs) from 98 power plants, with 68 of these plants monitored with our network of proprietary, patented sensors.
We also successfully integrated 30 of the crucial Pacific Northwest hydro facilities, delivering real-time estimates for major installations such as the Chief Joseph Dam (see image below).
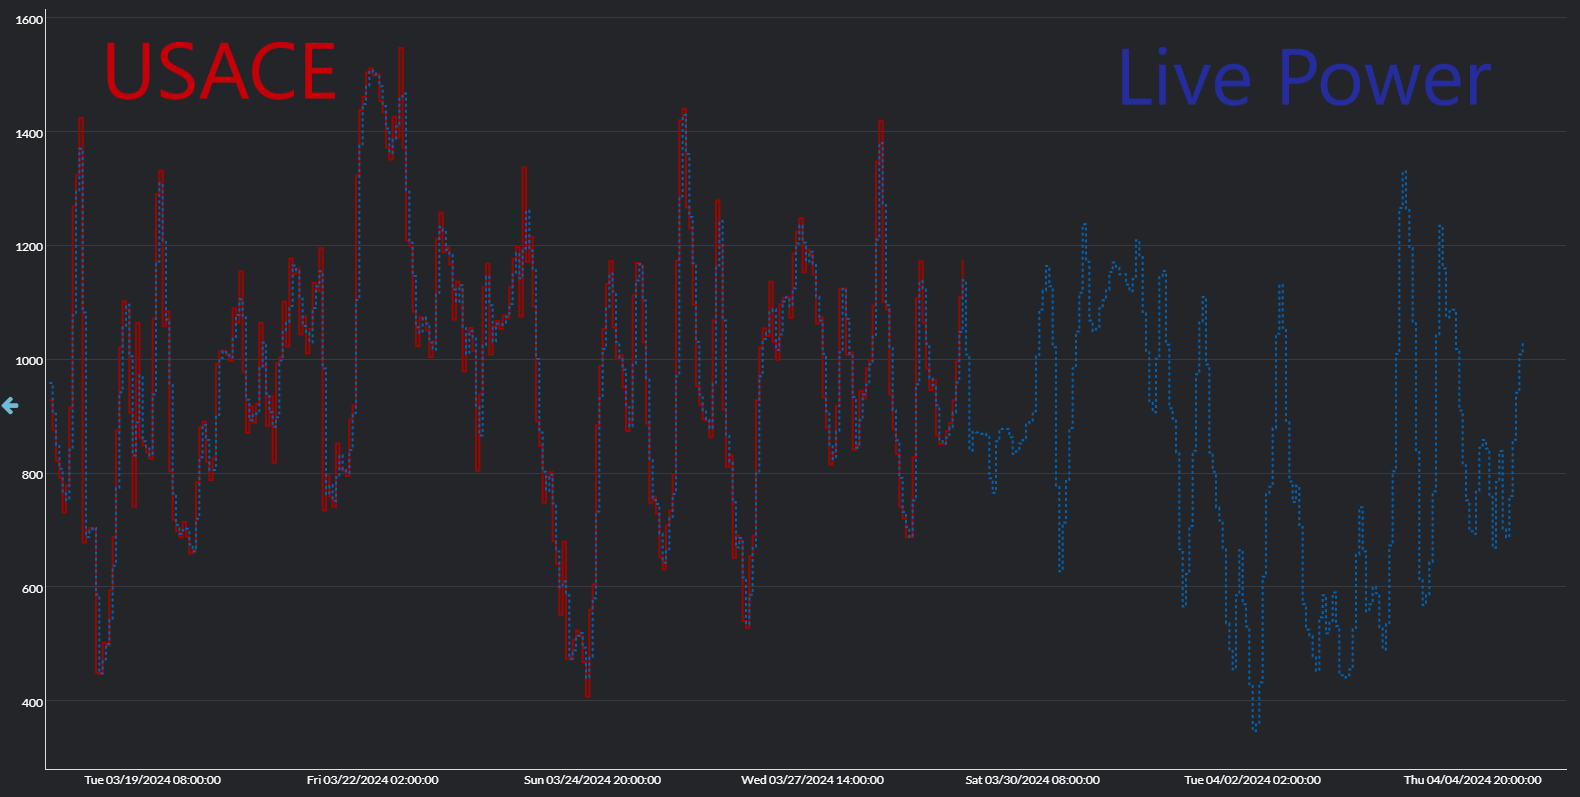
Source: Live Power
Before this integration, Chief Joseph Dam experienced an eight-day lag in generation data availability. These updated real-time generation monitoring estimates enable you to stay ahead of the market with the most relevant plant and transmission flow measurements.
Our commitment to expanding coverage continued throughout the year. By the end of 2023, we added over 131 GW of coverage, including an additional 13 GW of coverage in CAISO and WECC.
Our customers largely drive this growth, and we're proud to say we've met 67% of customer requests through rigorous feasibility studies.
Track Electric Power Demand
In 2024, we’ll continue to add more plants and lines. We're also focusing on large load centers, especially in the Electric Reliability Council of Texas (ERCOT), which has over 30,000 megawatts (MW) of load with planning studies already approved with an online year of 2027.
As the amount of large load centers continues to increase, it's important to track power consumption. In ERCOT, there are four coincident peak days in June, July, August, and September. Coincident peak days are important because they're used to calculate demand charges for the next year.
For example, on August 9, 2023, the ERCOT load was forecasted to reach a peak of 85.5 GW, the second-highest load forecast of the summer at the time. As we see in the image below, actual peak load came in 1.4 GW lower than the hour-ahead forecast at 84.0 GW, and had a flat load shape across peak hours starting at 3 p.m. Central Time. This is indicative of curtailment across large commercial and industrial customers. The following day, August 10, 2023, we see a typical load shape with a peak of 85.6 GW at 5 p.m. Central Time. August 10 was one of the four coincident peak days in ERCOT last year.
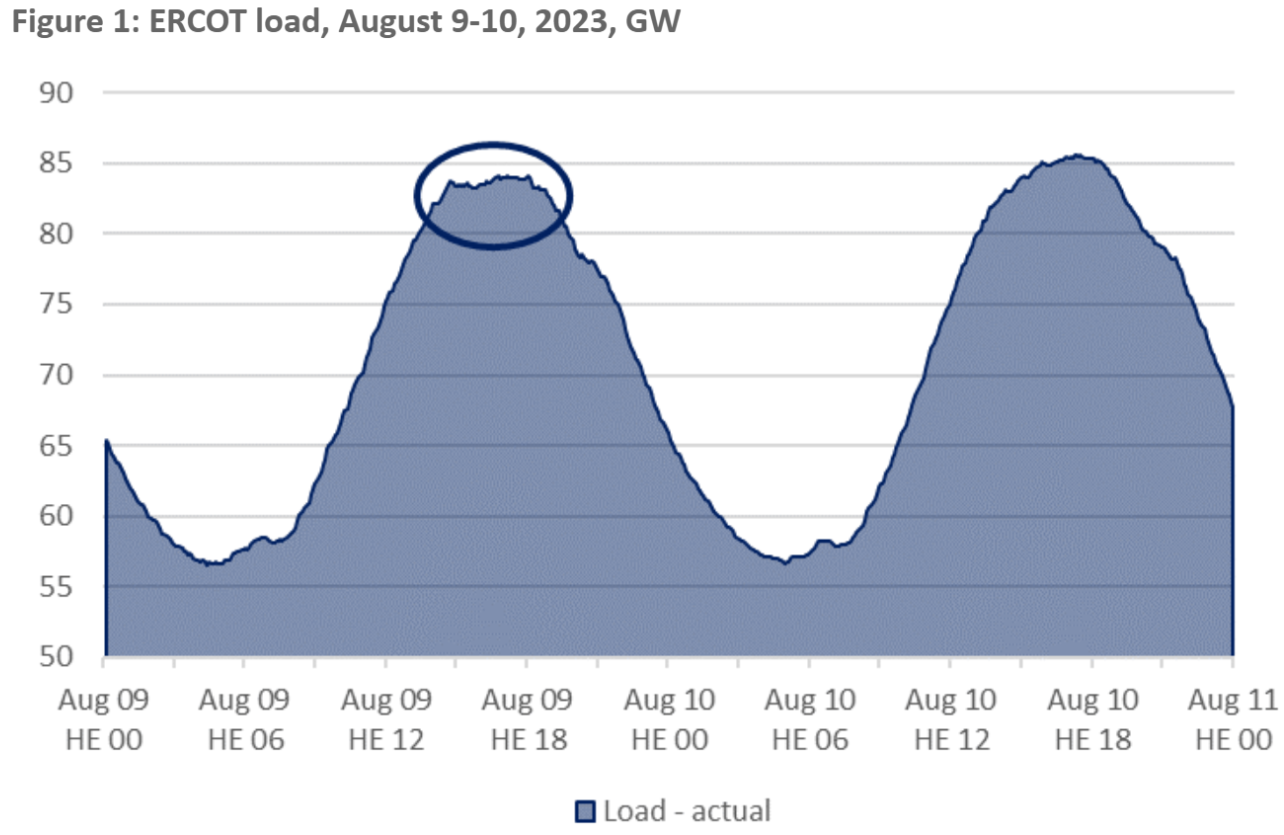
ERCOT load
Live Power is monitoring load from operations like bitcoin mines and liquified natural gas (LNG) facilities. When we look at the Live Power data (see below), we see Rockdale Crypto curtail on both August 9 and 10. Freeport LNG (the gray line shown below) kept all three trains online for both days.
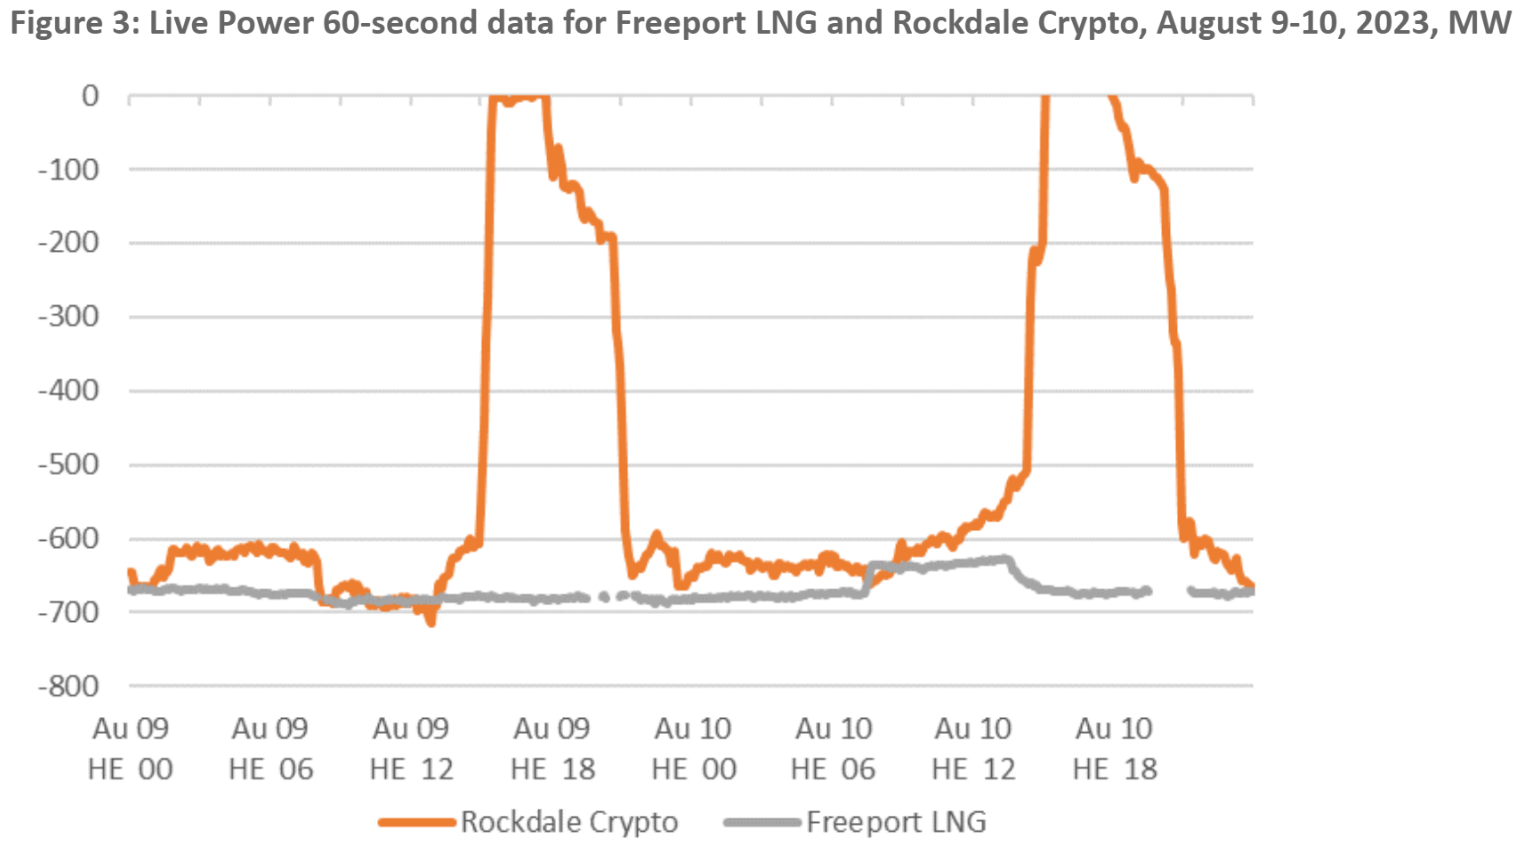
Rockdale Crypto and Freeport LNG load viewed through the Live Power module
The curtailment – or lack of curtailment – of these facilities is important to watch when trying to forecast these four coincident peak days in ERCOT. In addition to the over 600 MW of load we monitor at Rockdale and the 600 MW Freeport LNG facility, we've deployed additional devices to enhance our load monitoring coverage by over 1200 MW.
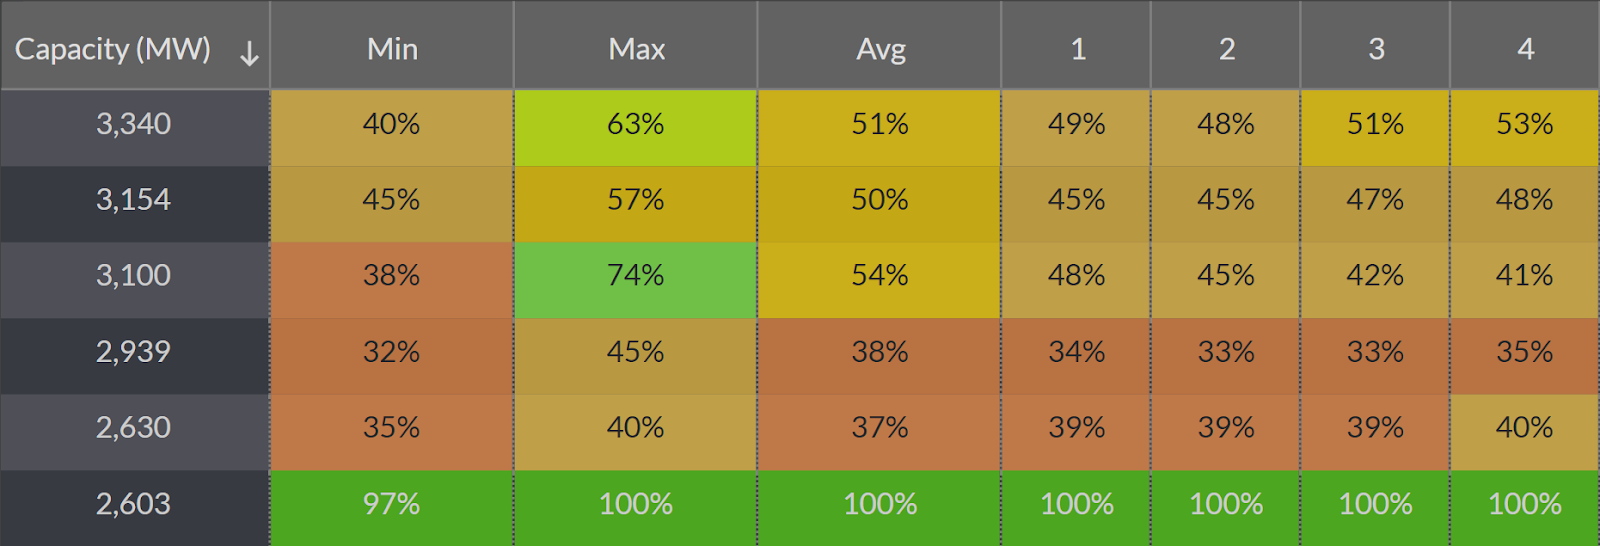
Obtain Real-Time Capacity Factors
Live Power deploys over 1,700 sensors across the US that send data every 60 seconds so you can get real-time information into capacity factors. You can see which power plants and transmission lines are nearing their limit, generating, or not generating to see market events unfold in real time.
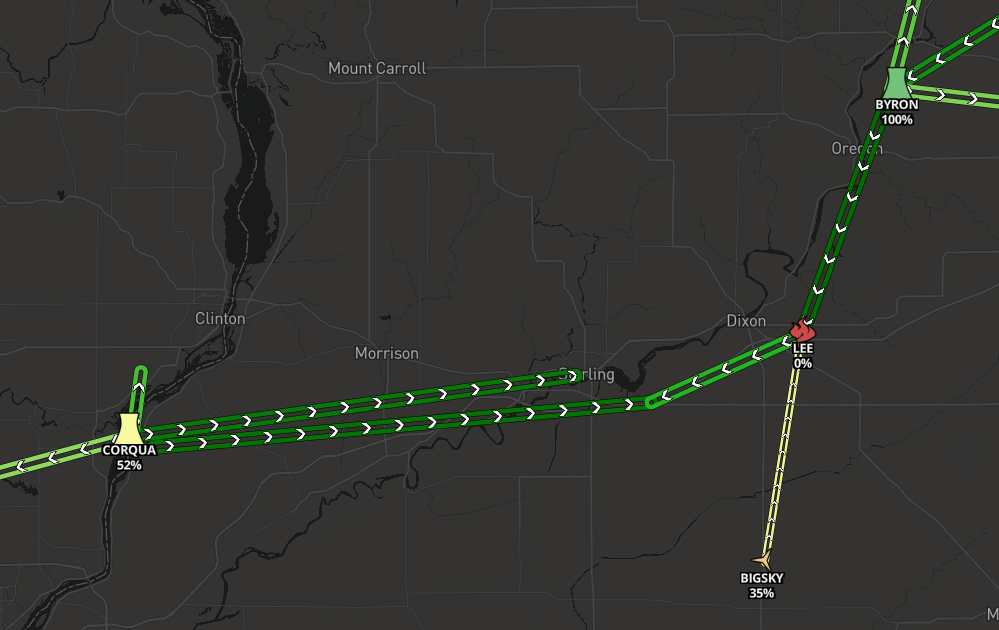
Source: Live Power
Watch Market Events Unfold in Real Time
Our data also allows you to see market events happen in real time. The chart below shows the Live Power generation estimate for Javelina Wind I / II for September 6, 2023. On that day, ERCOT blew through an Energy Emergency Alert 1 and directly into an Emergency Alert 2 during the tightest grid conditions since Winter Storm Uri.
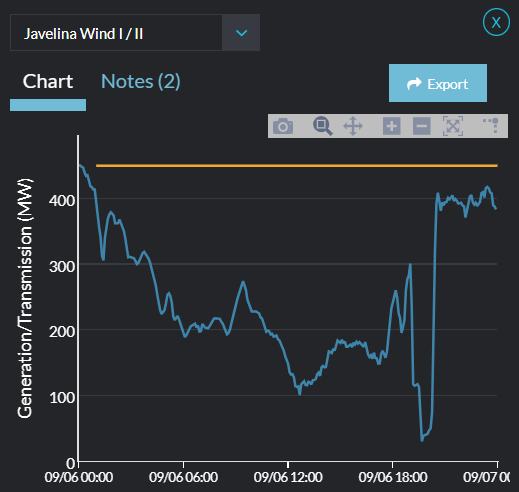
Source: Live Power
With Live Power, you can see a nearly 1 GW reduction in ERCOT Coastal and South wind production in just 30 minutes correlated to a drop in system frequency to 59.77 hertz. This is important since maintaining the grid frequency around 60 hertz is critical to prevent generators from tripping offline, a scenario that could lead to widespread outages.
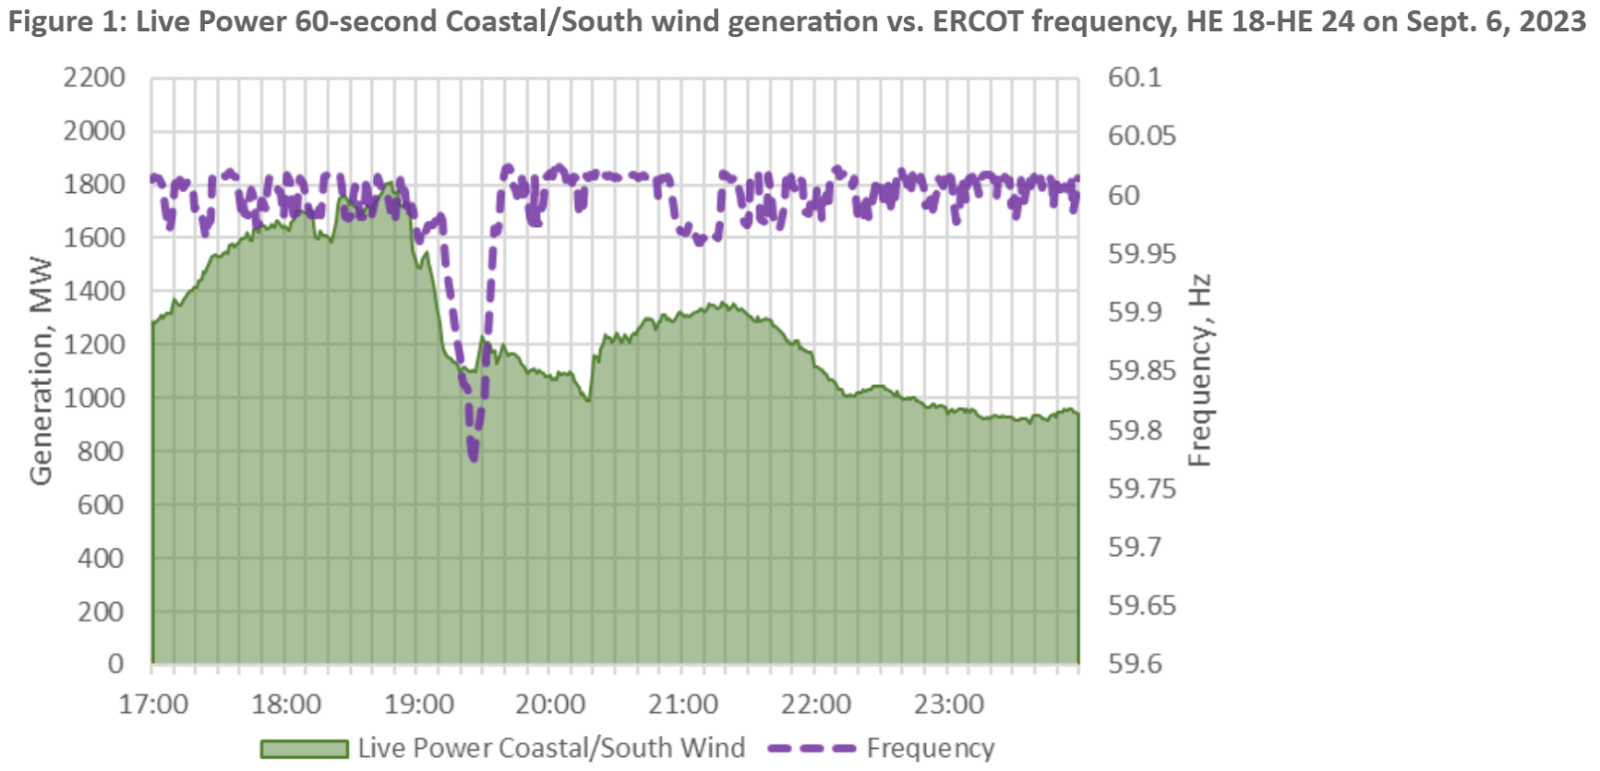
Source: Live Power
Gain Regional Insights into the Power Supply Stack
Next, let’s look at how you can use Live Power to gain regional insights into the supply stack.
We’ve aggregated our Live Power 60-second individual power plant generation data into a zonal view so you don’t have to. In the image below, we see the new PowerSignals® homepage, where you can quickly evaluate a zone and see how much Live Power monitored renewable generation is online or offline for each hour, alongside how much thermal generation is online for that same zone.
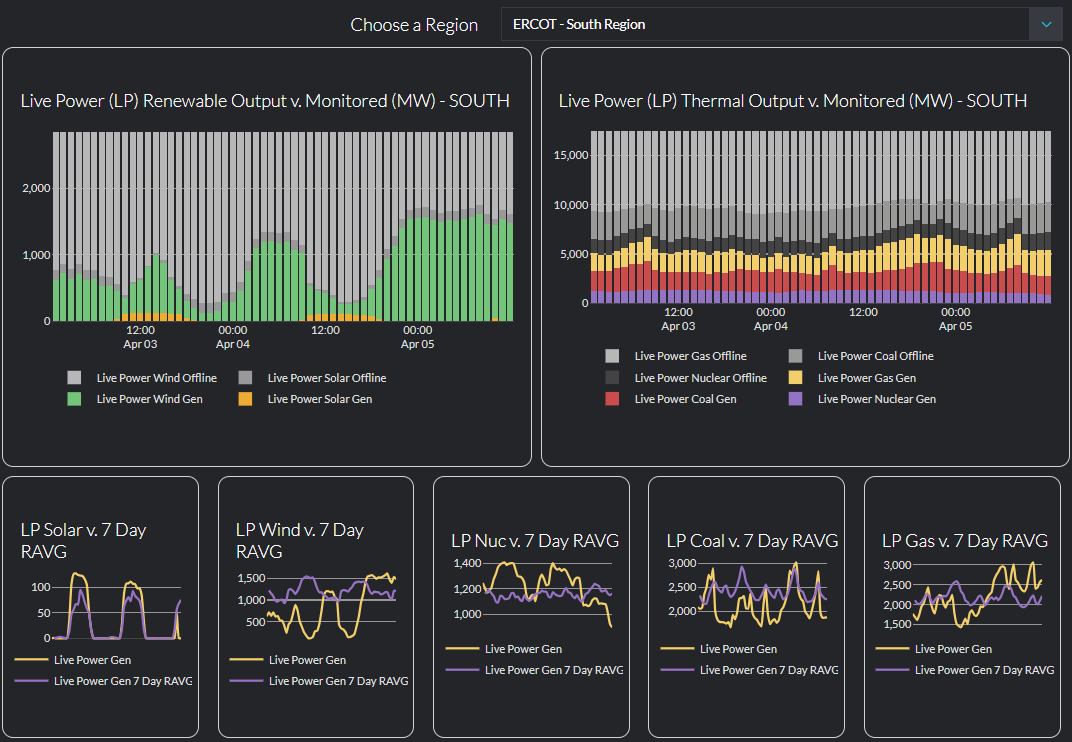
Source: PowerSignals
Analyze Historical Trends
You can also use Live Power to analyze historical trends and see which power plants and fuel types are running during any hour of the day (see image below).
Source: Live Power
Our tool also allows you to view changes over time.
Below is a delta view we created so you can easily see how plant generation and line flow differ from the previous minute or day. Financial transmission rights (FTR) traders can also view month-over-month changes.
Source: Live Power
Link Generation to Constraints
While Live Power allows you to receive updates on generation and transmission output every 60 seconds, you can also take advantage of our Yes Energy® object mapping to further your analysis. Since Yes Energy maps all Live Power facilities to their price nodes in the US, you can easily see how a specific generator is going to affect a constraint.
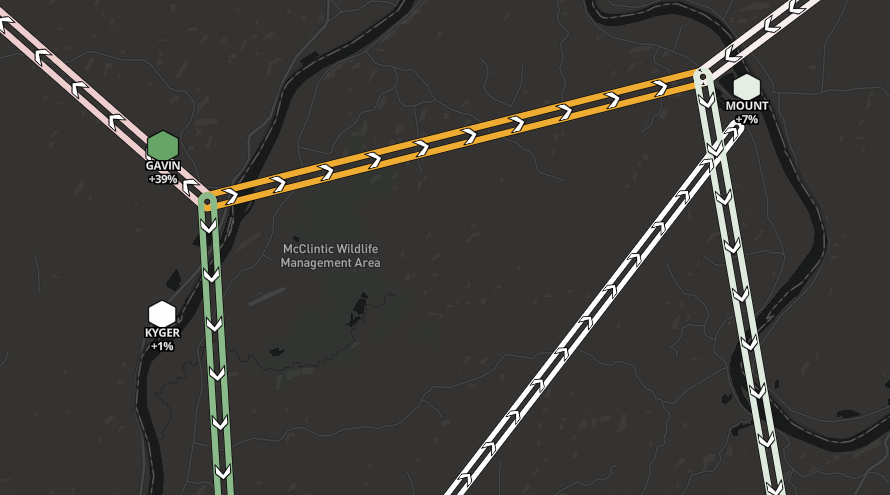
In the example below, we track the Coleto Creek price node to examine the source shift factor column and see what the generation output is going to do to each of these constraints. The negative shift factor indicates that by generating, Coleto Creek is going to exacerbate the Calavers to Pawnee constraint.
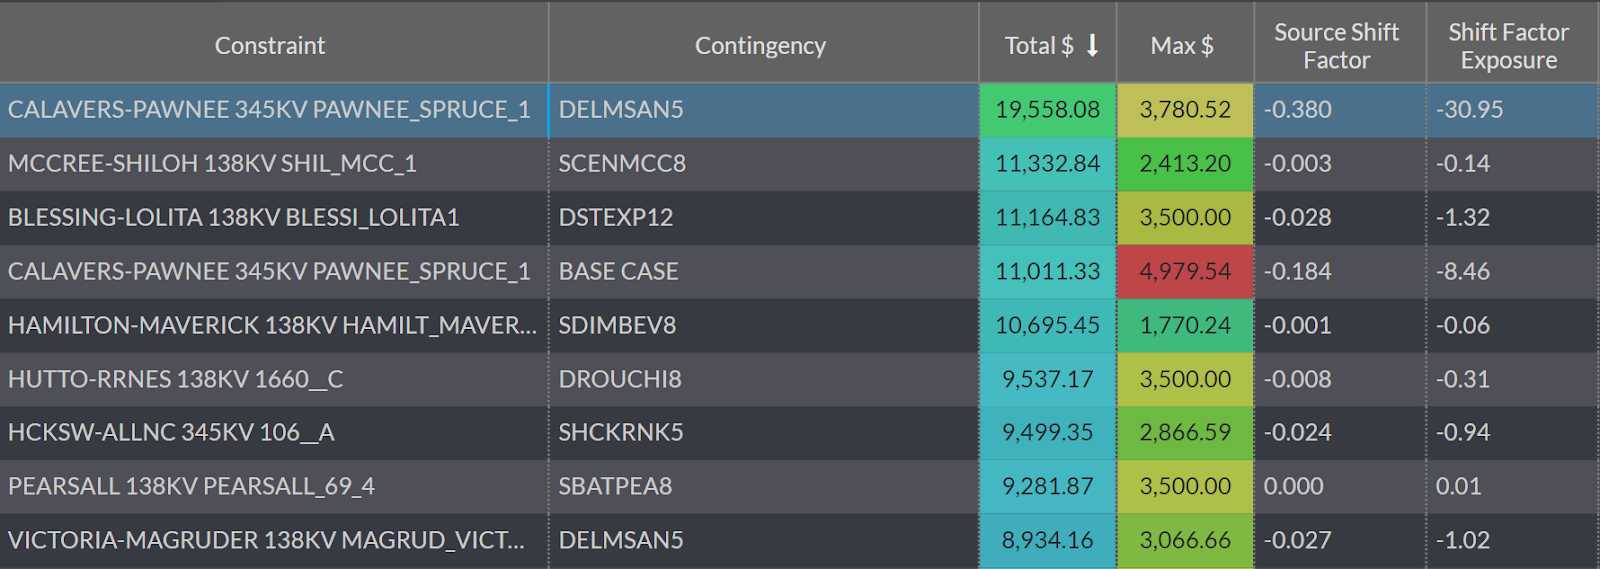
Source: Live Power
Identify High-Leverage Plants
You can also use Live Power to find high-leverage plants for a given constraint.
Using our Constraint Summary tool (see below), you can see that the Charlie Creek to Watford 230 KV constraint in Midcontinent Independent System Operator (MISO) and Southwest Power Pool (SPP) is going to help alleviate that constraint by generating.
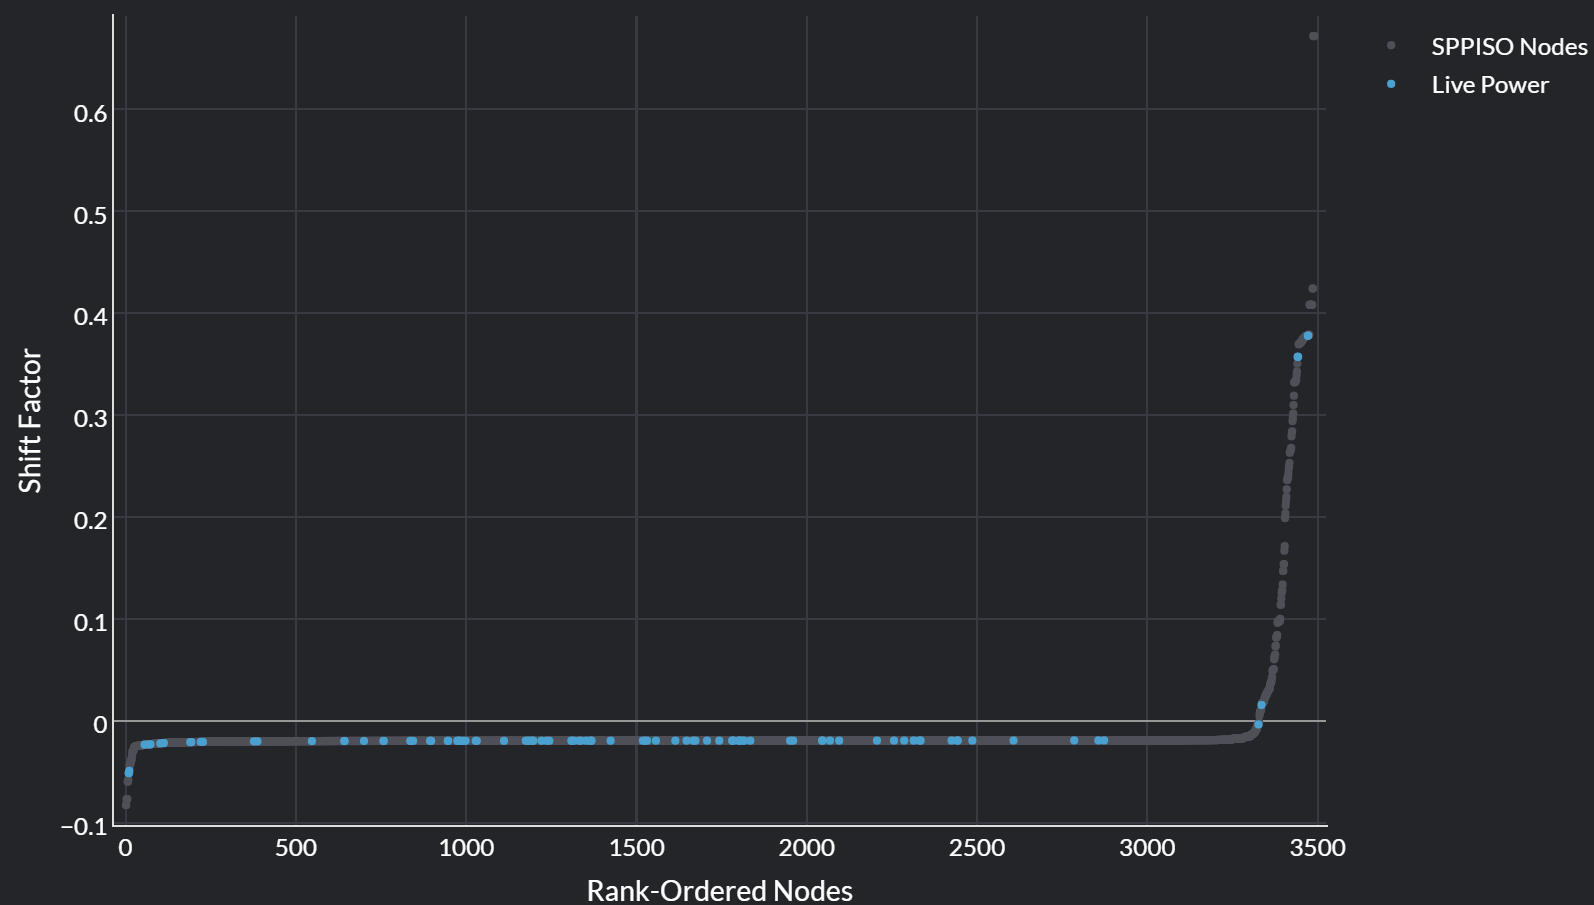
Source: Live Power
View Constraints and Output in Real Time
Last, but not least, you can use the Live Power module to know when Charlie Creek to Watford begins binding, and then you could also look at the generation of Pioneer alongside it in real time.
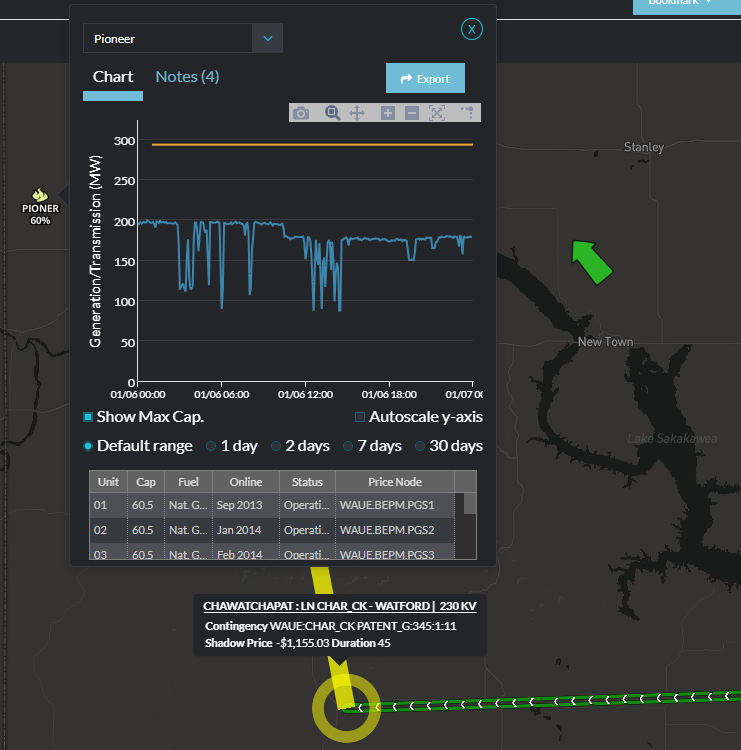
Source: Live Power
How Live Power Data Insights Power Your Business
With Live Power by Yes Energy, the grid isn't just a complex network of cables and turbines; it's a story of energy, demand, and the constant ebb and flow of power that fuels our lives.
Our new offerings, like the PowerSignals® homepage and Capacity Factor tab, are direct responses to customer feedback, allowing you to scrutinize historical trends and monitor generation changes. We also empower you to connect generation data to grid constraints, enhancing your analysis capabilities.
With superior coverage of the most relevant plant and transmission flow measurements,
Live Power captures today’s most important market dynamics. Request a demo to gain better data, better delivery, and better direction today!

 About the author: Amber Armentrout is the vice president of operations for Live Power, Yes Energy’s premium grid-monitoring service. She is an enthusiastic leader striving to provide the most accurate real-time generation and transmission data to energy traders. She graduated from the University of Colorado with a Bachelor of Arts in mathematics and economics. She enjoys running and spending time with her family.
