


Share this
by Alex Bennitt on Dec 14, 2023
Coal has followed a downward trend on a yearly basis but less so in the summertime because higher load levels necessitate dispatch from more expensive resources, such as coal generation. Coal generation decreasing in the summertime was something we noticed last summer in PJM and MISO, despite high natural gas prices, but this summer the coal generation decreases have spread more widely around the US, notably in SPP, which signals that coal dispatch economics are starting to rise relative to natural gas generation more widely around the US. In its place not only are combined cycle facilities seeing increased dispatch but also higher heat rate gas resources such as gas steam and gas turbine.
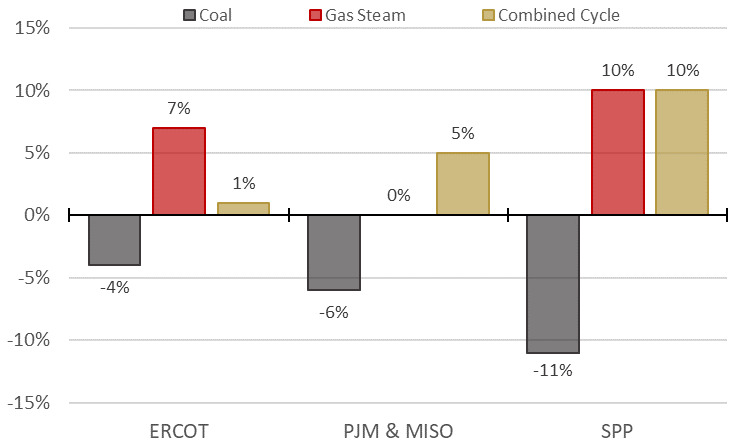
For the second straight summer, Live Power data across 265.1 GW of coal and gas generation in ERCOT, PJM, MISO, and SPP shows that average July to August coal production dropped in favor of cheaper natural gas generation. Among Live Power monitored facilities, coal capacity factors dropped four percentage points in ERCOT, six points in PJM/MISO, and 11 points in SPP.
This is a continuation of a large 11-point drop seen in July to August 2022 in PJM and MISO, where soaring coal and NOx emission costs fueled coal-to-gas switching even with over $7/MMBtu gas prices, and a 12-point drop in summer 2022 in ERCOT that was largely outage driven.
The decreases in coal generation were observed across 89 coal facilities, amounting to 113.5 GW of coal generation.
Conversely, Live Power coverage across 183 gas facilities, totaling 151.6 GW of gas generation, shows that combined-cycle gas turbine (CCGT) technologies led the way on gas generation increases, with an exception in ERCOT which saw gas steam technologies increase seven points, as the CCGT fleet was likely maxed-out in July to August 2022 (summer 2022) and remained relatively flat in a record-setting summer 2023.
Figure 1: YOY comparison of Live Power capacity factors for select dispatchable technologies, July to August 2022 vs. 2023, %
The key driver of coal-to-gas switching this summer was natural gas prices falling 68% to 82% around the US, which outpaced dropping coal (-68%) and NOx emissions costs (-87%) that flipped the traditional stack order last summer on coal and natural gas generation.
This summer, coal generation couldn’t catch a break as gas prices have fallen enough to position coal generation at a slight disadvantage in ERCOT and SPP, which didn’t experience ballooning coal prices and emissions costs seen in the Northeast last summer.
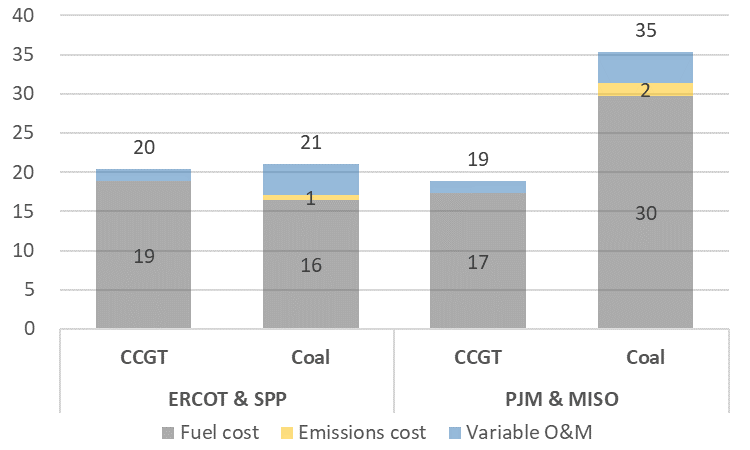
Dispatch costs for coal were 84% higher versus CCGTs in summer 2023 for MISO and PJM, with coal economics falling short of natural gas facilities with a 12.0 to 16.0 heat rate. The margin was much closer in ERCOT and SPP, with coal dispatch costs only at about $1/MWh premium to CCGT, but they indicate the start of a turning tide in those regions.
Figure 2: Comparison of illustrative variable dispatch costs for coal vs. CCGT for summer 2023, $/MWh
The rest of the analysis will break down Live Power 60-second data specific to each ISO and look into aggregate thermal dispatchable technology groups as well as plant-level data on which facilities increased/decreased the most YOY. A brief summary of each ISO is listed below.
ERCOT Gas Steam Picks Up Load Increases While Coal Generation Dips for Second Straight Year
Based on Live Power monitored resources in ERCOT, gas steam technologies increased seven points year-over-year (YOY) for July and August, going from 31% utilization in 2022 to 38% utilization in 2023. This increase is on the heels of record load in ERCOT this summer.
Conversely, coal-fired facilities decreased four points YOY, from 60% utilization in 2022 to 56% utilization in 2023, continuing a two-year trend of decreases that started last year when coal dropped 12 points. Combined-cycle gas turbines increased one point YOY, as the fleet was likely already near maximums after large load increases last summer.
Table 1: YOY comparison of capacity factors for Live Power monitored thermal dispatchable technologies in ERCOT
.png?width=1502&height=720&name=ERCOT_Table%20(1).png) Note: Based on 125 Live Power monitored plants in ERCOT - 73 GW total capacity comprised of 59 GW dispatchable capacity and 14 GW of renewable capacity
Note: Based on 125 Live Power monitored plants in ERCOT - 73 GW total capacity comprised of 59 GW dispatchable capacity and 14 GW of renewable capacity
For Second Summer, PJM and MISO Coal Takes Back Seat to Cheaper Natural Gas Production
Based on Live Power monitored resources in PJM and MISO, coal capacity factors averaged 47% in July to August 2023, a drop of six points from 53% utilization in July to August 2022. This marks the second straight year that coal generation has dropped in the ISOs, after a decrease of 11 pts. in July to August 2022 vs. 2021.
Conversely, gas-fired combined cycle turbines (CCGT) capacity factors increased five pts. to 62% from 67%. Nuclear and gas turbine technologies also increased four pts. and two pts. respectively.
Table 2: YOY comparison of capacity factors for Live Power monitored thermal dispatchable technologies, PJM and MISO
.png?width=1515&height=733&name=PJM_MISO_Table%20(1).png) Note: Based on 333 Live Power monitored plants in PJM and MISO - 254 GW total capacity comprised of 236 GW dispatchable capacity and 18 GW of renewable capacity
Note: Based on 333 Live Power monitored plants in PJM and MISO - 254 GW total capacity comprised of 236 GW dispatchable capacity and 18 GW of renewable capacity
In a Summer with Record Peak Load, SPP Combined Cycle Generation Replaces Coal and More
Based on Live Power monitored resources in SPP, combined cycle gas turbines (CCGT) and gas steam both saw 10-point increases in utilization.
On the other hand, coal generation dropped 11 pts. from 73% in summer 2022 to 62% in 2023. With July to August average load remaining relatively flat YOY at 38.7 GW (-0.4 GW YOY), CCGT appears to have replaced coal generation and more in a summer where the ISO set the all-time peak load record at 55.8 GW.
Table 3: YOY comparison of capacity factors for Live Power monitored thermal dispatchable technologies in SPP
.png?width=1542&height=721&name=SPP_Table%20(1).png)
Note: Based on 126 Live Power monitored plants in SPP - 52 GW total capacity comprised of 236 GW dispatchable capacity and 18 GW of renewable capacity
Want to learn more? Log in to read the full market driver alert to explore the numbers further.
Have questions or want to take a deeper dive into the data? Let's discuss how our transmission grid monitoring solution, Live Power®, could keep you a step ahead of market moves.

 About the author: Alex Bennitt is the product manager for Live Power and partner content integration at Yes Energy, where he utilizes a seven-year background in market fundamentals and Live Power operations to help steer product direction. In his free time, Alex is an avid skier who chases snow almost year-round.
