


Share this
by Alex Bennitt
Severe cold weather rolling down from Canada – unofficially called Winter Storm Heather – hit Texas Saturday, Jan. 13, 2024. Days before cold temperatures hit, ERCOT demand forecasts predicted an 85.5 GW peak during the event, which would shatter the winter operations record and rival the all-time demand record set in ERCOT this summer. This sent market forwards for North Hub (NHub) real-time on-peak over $500/MWh, and concerns about system reliability, once again, began to make the rounds.
How did ERCOT fare during Heather? Low thermal outages, demand response, and a major load forecast miss made for easy sailing for the ISO, which … was not surprising news to subscribers of Demand forecasts (formerly TESLA) and Live Power real-time grid data. Demand Forecasts were consistently three to seven GW lower than ERCOT estimates for the week leading up to presumed tight grid conditions on Jan. 16. Twenty-four hours before peak load on Jan. 16, Yes Energy forecasted 81.7 GW versus ERCOT’s 86.3 GW, which would have broken the all-time demand record set this summer (see Figure 1).
Figure 1: Yes Energy Demand Forecasts (formerly TESLA) vs. ERCOT peak load forecast by generation date for January 16, GW
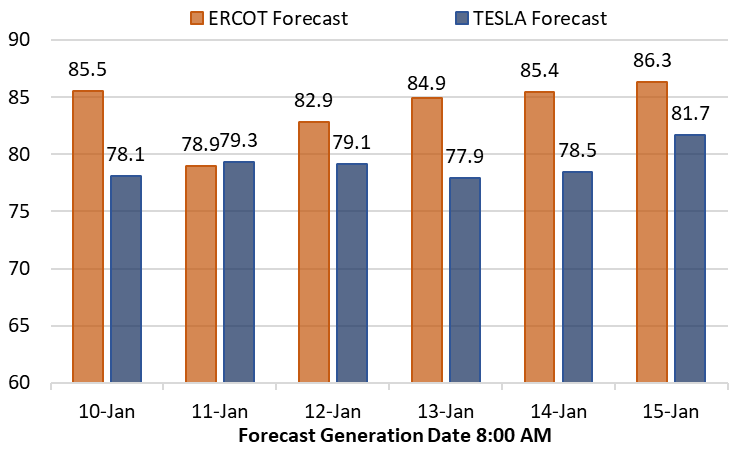
Over-forecasting demand is not new for ERCOT, and it has repeatedly communicated the use of conservative operations with regards to high demand periods, leading to over-forecasting demand and under-forecasting renewables, which can help better signal the market for scarcity. But for those participating in a market clearing off of these conservative operations, having a high-quality, reliable demand forecast has become a top priority, and Yes Energy forecasting solutions had ERCOT customers covered.
How did the actuals end up during Heather? Peak demand reached 78.1 GW (-8.8 GW, -10%) on Jan. 16, which was 8.8 GW below ERCOT forecast and represented a 10% miss. Comparatively, the Yes Energy forecast was only 3.6 GW high, representing a 5% miss and a 41% improvement from ERCOT’S forecast (See Figure 2).
Figure 2: ERCOT load vs. forecast, Jan. 15-16, GW
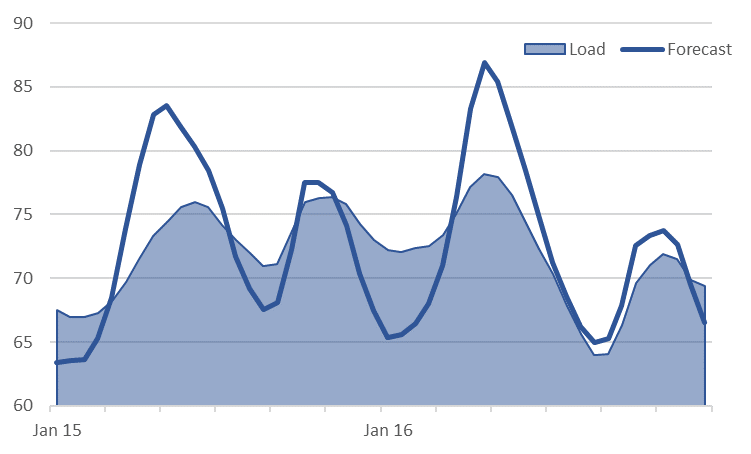
ERCOT load forecast vs. ERCOT load actuals
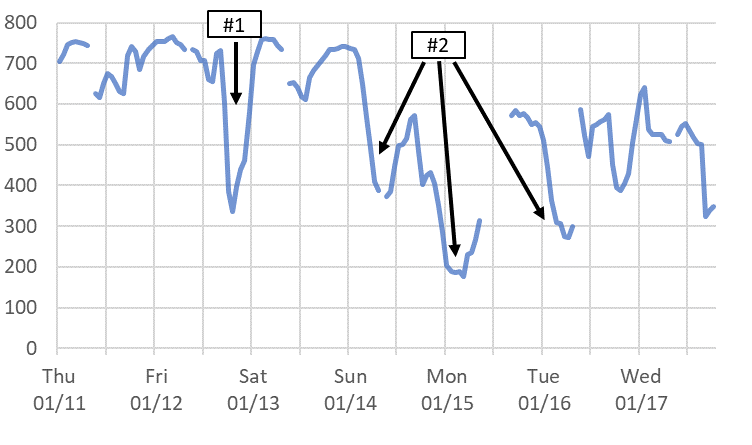
Helping keep demand under check during Heather was a number of load side resources that weren’t drawing full power. Notably, Live Power monitors on Freeport LNG showed the facility ramp down load below 400 MW during the early morning hours of Jan. 14-16, providing around ~300 MW of demand relief (see Figure 3 #2). The facility did start ramping back up to 600 MW load once the sun rose on each of these days. Earlier in the week, the facility was operating at its full three-train load, and the reasoning for the shutdown is unknown, but it could be tied to cold temperature operations, gas availability concerns, or poor facility economics with presumed high natural gas prices. It is unknown if the facility has the ability or desire to provide demand response to ERCOT, but Friday, Jan. 12, the facility did curtail operations during an astounding 22.0 GW two-hour net load ramp (See Figure 3 #1). This is in stark contrast with monitored load at the facility this summer, when Live Power data did not show the plant interrupt operations once when ERCOT operated above 2022’s all-time load record for over 200 hours.
Figure 3: Live Power monitored Freeport LNG load, Jan. 11-17, 2024, MW
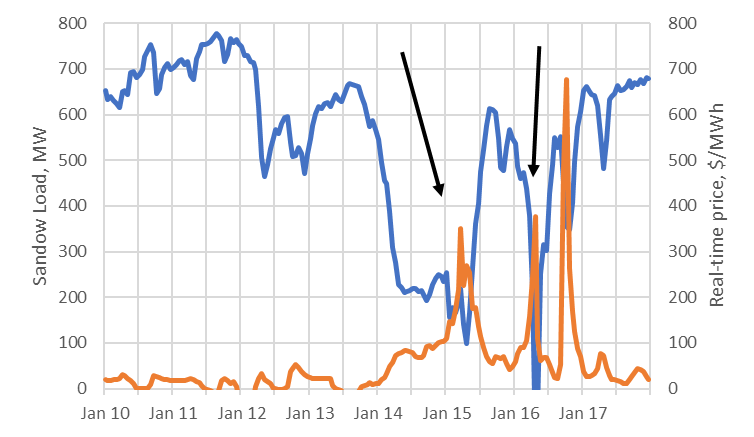
On top of Freeport LNG, Live Power monitored Sandow Crypto load (of which at least Rockdale Crypto is a part) also curtailed operations near peak hours, providing 600-700 MW of load reduction. The load behind Sandow completely shut off in the early morning on Jan. 16 and ramped down to 100 MW on Jan 15. It is unknown how much of the load curtailment can be attributed to economics or demand response obligations, as the Sandow price node exceeded $400/MWh during these peak demand hours. The facility did curtail operations earlier in the weekend with price <$50/MWh for unknown reasons, and it could be demand response related.
Figure 4: Live Power monitored Sandow Crypto load, Jan. 11-17, 2024, MW
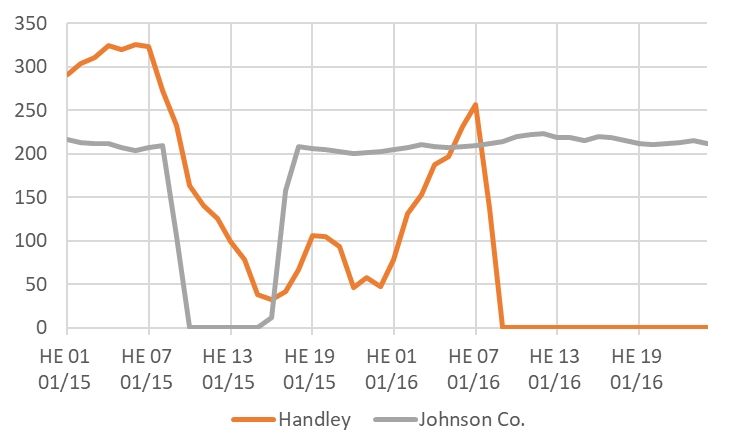
ERCOT’s thermal fleet was prepared for Winter Storm Heather, and as a result, ERCOT total resource outage capacity remained below 6 GW on Monday and Tuesday. Natural gas facilities did not experience gas availability issues, coal and wind didn’t freeze up, plus no snowfall allowed solar to kick in full strength each day when the sun rose. However, Live Power data does show two facilities tripping offline during winter storm Heather: Johnson County and Handley.
Handley tripped its last available unit offline at 7:30 a.m. Tuesday morning and has remained offline since (other two units on outage reported by ERCOT). Due to the timing of the facility shutting down right before the morning’s net load peak of 68.9 GW, North Hub (NHub) real-time prices jumped $114/MWh to $503.87/MWh.
On the other hand, Johnson County tripped offline after the sun had risen and ERCOT was easing off Monday morning's net load peak. Johnson County tripped 210 MW of capacity offline just before 8:30 a.m. and NHub real-time prices actually dropped $20/MWh to $227.39/MWh. The facility was able to get back online at 3:45 p.m. the same day (see Figure 5).
Figure 5: Live Power Handley and Johnson County generation, Jan. 15-16, 2024, MW
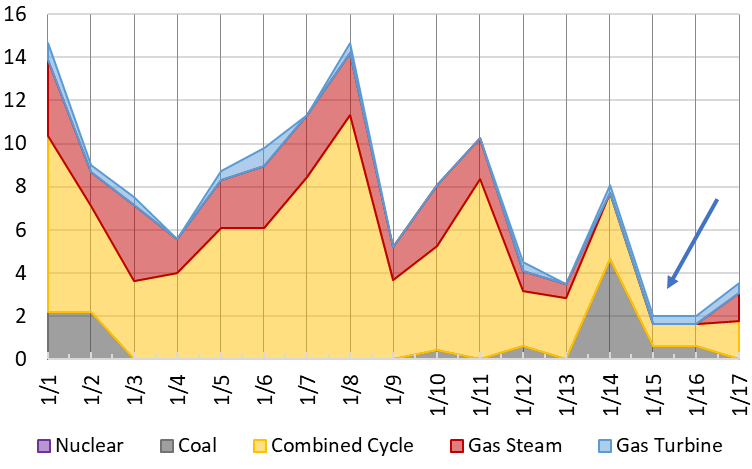
While resource outage capacity in ERCOT was low, Live Power monitored ERCOT facilities identified that Coleto Creek did not start throughout the storm. Furthermore, Live Power data provides technology breakdowns of offline capacity, providing a more granular look at offline capacity than ERCOT’s ISO-wide number. Offline capacity shows a stark drop Jan. 15 as generation got online before the storm.
Figure 6: Live Power daily offline capacity by technology type, 2024 YTD, GW
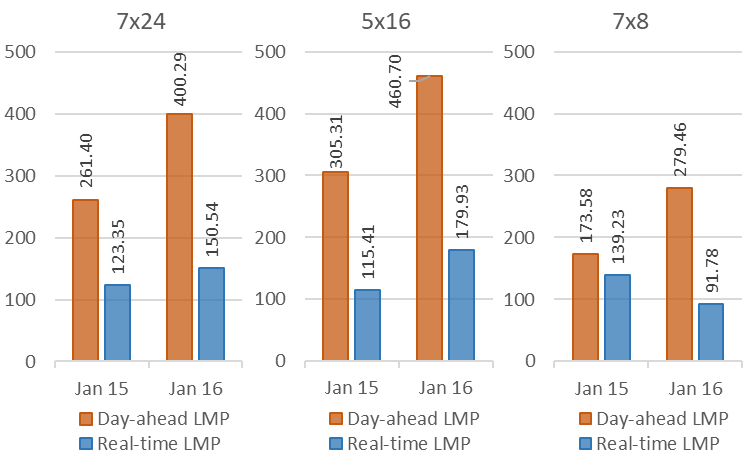
Strong performance from the ERCOT thermal fleet, combined with lower net load levels, made for a scenario where real-time NHub prices did not see ultra-high levels, even in HE 8 when the grid was forecasted to be at its tightest conditions. Only one hourly real-time interval cleared over $500/MWh, and it was during the sundown net load peak as opposed to the pre-sunup net load peak.
That is in stark contrast with day-ahead prices that cleared off of ERCOT conservative operations where demand was forecasted to break the all-time record in HE 8 Jan. 16. Day-ahead prices peaked at $1994.65/MWh during that all-time demand forecasted hour and made for a scenario where daily day-ahead-real-time (DART) spreads by block skewed heavily positive towards day-ahead prices.
Figure 7: ERCOT North Hub day-ahead vs. real-time prices by block, Jan. 15-16, 2024, $/MWh
Another reason that real-time prices didn’t see ultra-high clearing levels is due to lower participation from energy storage resources (ESRs) than seen during other high-demand periods. Net ESR output to ERCOT peaked just above 1.0 GW in the morning hours of Jan. 16, and similar levels were generated four other times from Jan. 9-16. System conditions, notably physical responsive capability (PRC) and high ancillary service limit (HASL) did not indicate that ERCOT was getting close to the top of the generation stack and therefore didn’t require clearing ultra-high energy offers from ESR assets, which a significant portion of capacity offers at, or near, the price cap.
The one interval that HASL dipped below 3.0 GW saw the highest hourly real-time price of $675.45/MWh at NHub, which could indicate that real-time SCED started to dip into higher real-time ESR offers. It is important to note that the majority of ESR capacity clears in the ancillary market, and as of July 2023, only 900 MW of real-time ESR offers were available to SCED (see more in our ERCOT trends whitepaper). ERCOT is reporting 6.0 GW of commercially operable ESR capacity in its Jan. 16. ESR integration report, so it is possible that new capacity has started to push ESR energy offers down.
Figure 8: ERCOT Energy Storage Resource (ESR) net output (right, MW) vs. load (left, MW), Jan. 9-16, 2024
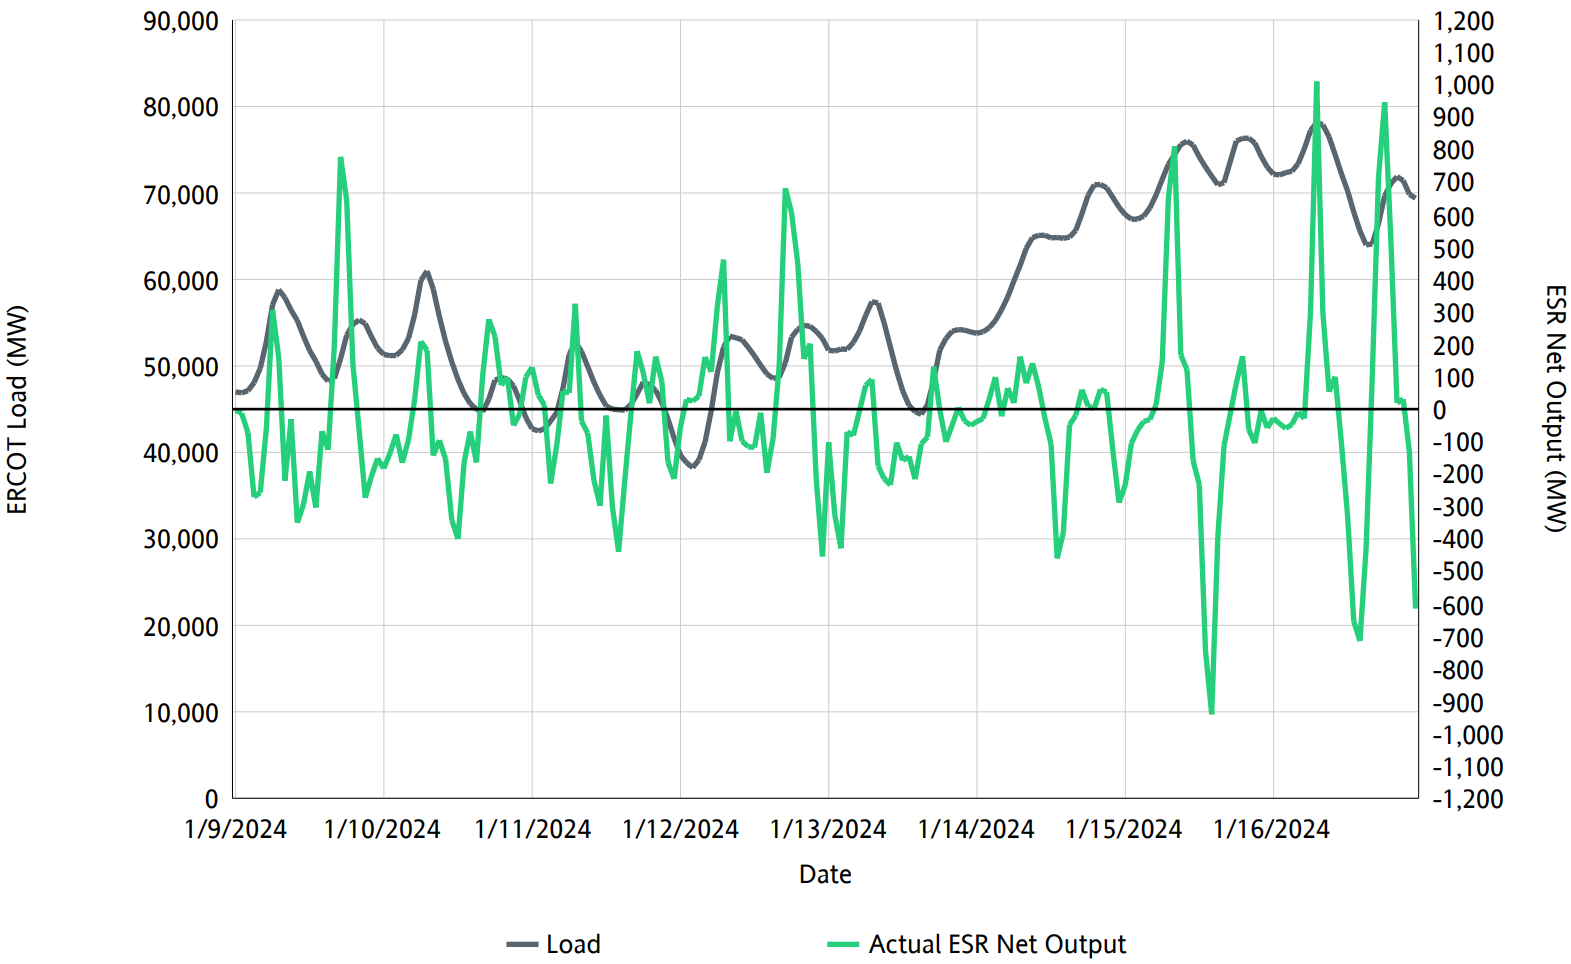
Source: Jan. 16 ERCOT ESR Integration Report
The market economics from Winter Storm Heather make it clear that when grid operations are forecasted to get tight, having reliable data through Yes Energy Demand Forecasts and real-time supply side and demand side data through Live Power are critical. Customers of both were able to see through ERCOT’s conservative operations noise and Win the Day AheadTM!
Have questions or want to take a deeper dive into the data?

 About the author: Alex Bennitt is the product manager for Live Power and partner content integration at Yes Energy, where he utilizes a seven-year background in market fundamentals and Live Power operations to help steer product direction. In his free time, Alex is an avid skier who chases snow almost year-round.
