


Share this
by Ben Perry
You want to track trends when projecting electricity demand into the medium to long-term future – but fluctuations in weather patterns can make that a challenge.
We conducted an in-depth analysis of the last six summers in the Electric Reliability Council of Texas (ERCOT) to strip away the effect of extreme weather and estimate what demand would have been under normal weather conditions. This will help us make more accurate projections for the coming summer. (We previously looked at weather during Winter Storm Heather, but now we're diving into summertime trends.)
The Problem: Electricity Demand Forecasting Is a Challenge Using Metered Data Only
It’s difficult to quantify electricity demand trends using metered load data.
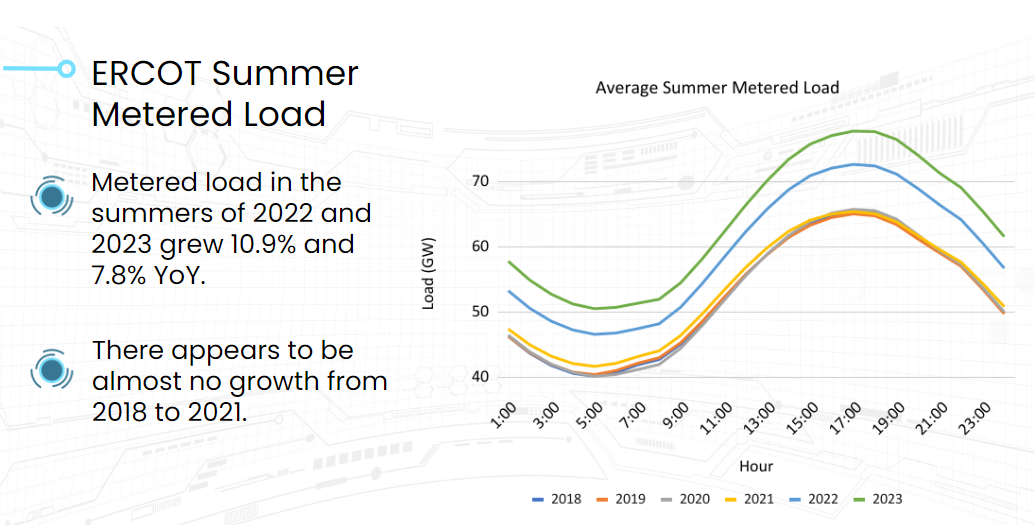
For example, we averaged the metered demand ERCOT published for the past six years and grouped it by hour. For four years, there seems to be no growth and then it ramps up dramatically.
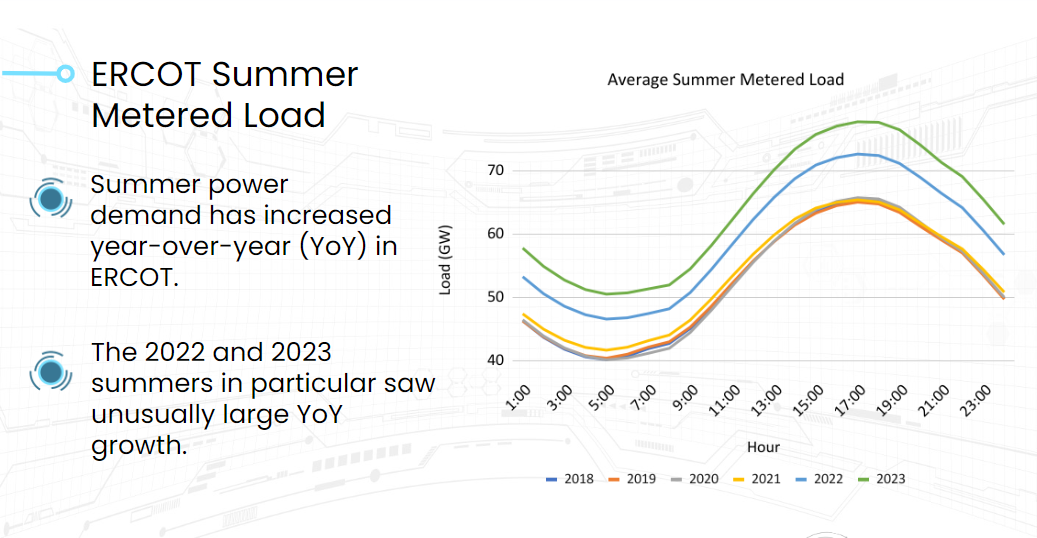
This caused us to wonder: What caused the growth in 2022 and 2023? Was it a population increase? A spike in summer temperatures? Economic growth?
We broke it down a bit further by looking at the average temperatures for those summers in Texas. We see that 2022 and 2023 were hotter on average than the previous five years. 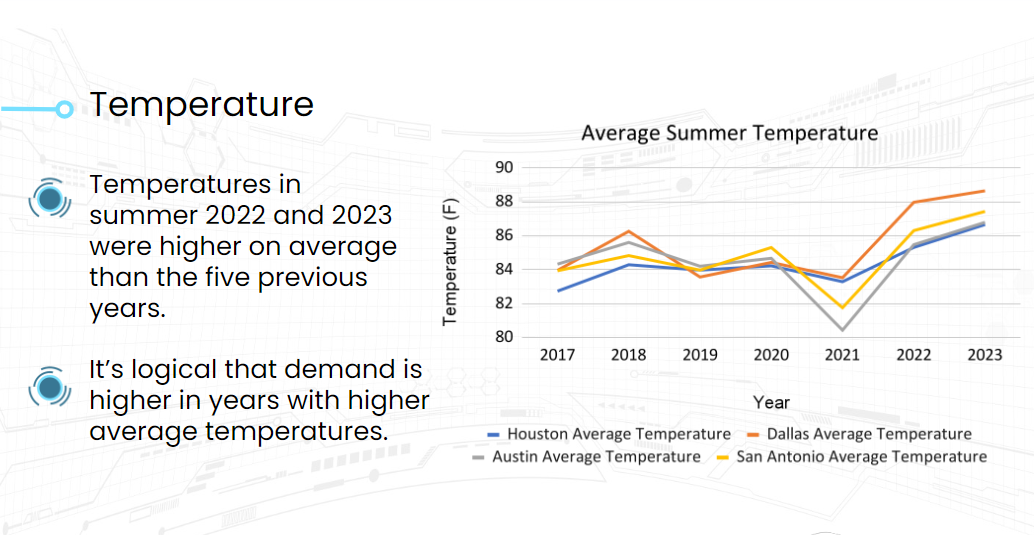
However, we can’t quantify how much of the increased demand was caused by population or economic growth versus fluctuations in average temperatures from year to year.
We want to determine the base demand, stripping away weather effects. If Texas had experienced average temperatures, how much power would customers have used?
Let’s dive deeper into this analysis so we can make projections for summer 2024.
Our Solution to Adjust Metered Load Data for Weather Effects
We used some calculations and our Demand Forecasts Weather Decomposition Tool (formerly TESLA) to peel away the effects of weather. This tool does two things:
- Quantifies the effect weather had on the demand over a historic period in units of power and
- Adjusts metered demand to climatic average (“normal”) weather conditions.
This diagram depicts how we do that.
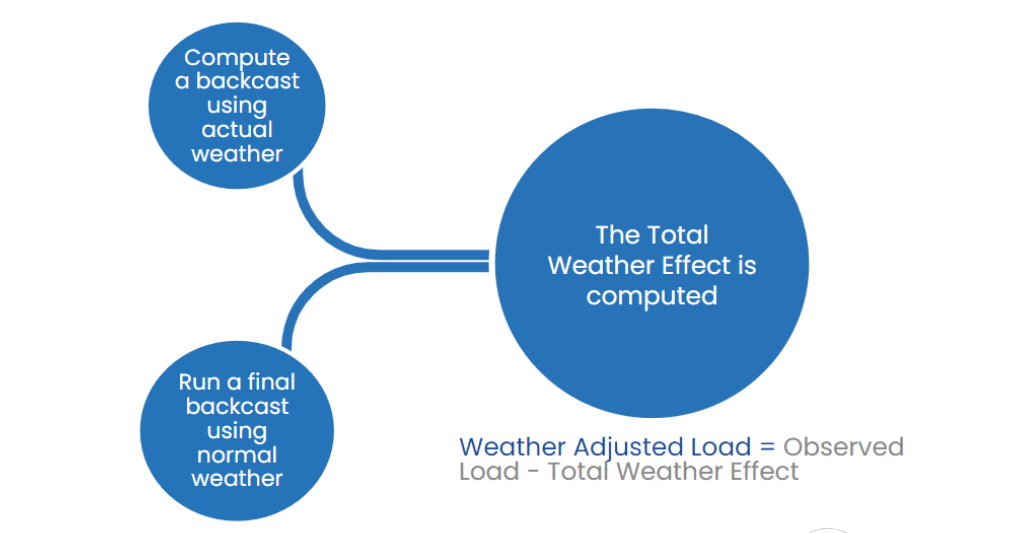
To generate an accurate US electricity demand forecast, we need a model that fits the demand patterns well.
First, we give the model the observed weather for the past dates. That gives the model's best estimate for electricity consumption on those dates. Then, we take the same model and complete a solution for the past dates using weather averages. This provides a decent estimate of base demand.
However, we took it a step further to strip out any potential error in the model because no model is perfect (see diagram below).
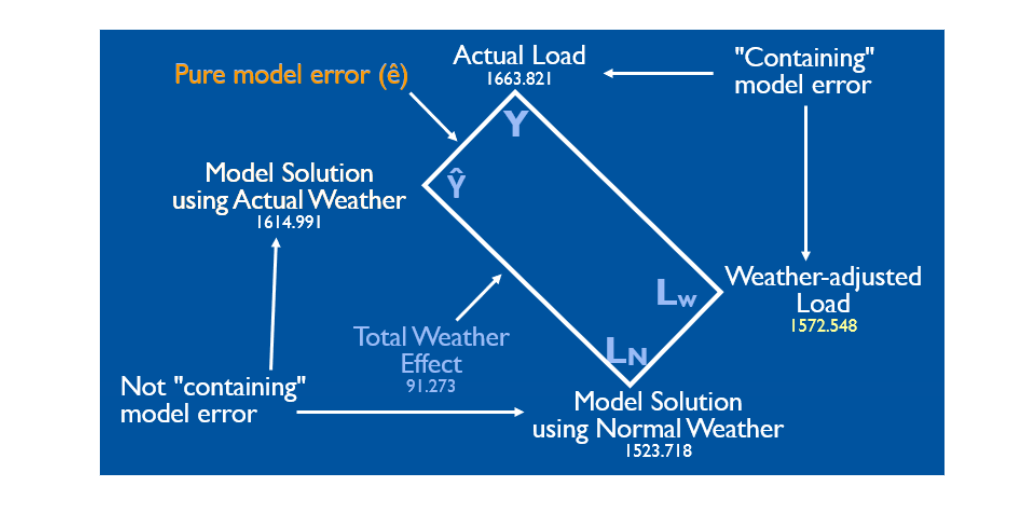
The left point in the rectangle is the model solution using observed weather, and the bottom point is the model solution using normal weather. The line between them is the total weather effect.
You can see there's a discrepancy between the actual load and our model solution, which is the model error.
We took this one step further and didn’t assume that our model solution with normal weather is the best estimate of base demand. We calculated the total weather effect and then subtracted it from the observed load data published by the Regional Transmission Organizations (RTOs) or provided to us by our clients.
This calculation gives us the point on the right, the weather-adjusted load, which is a better estimate of the base electricity demand.
To illustrate this, we dove into the data from January 11 to 24, 2024, according to ERCOT’s published reports. This shows the new all-time winter peak on January 16 at over 78 gigawatts (dark blue on the graph below).
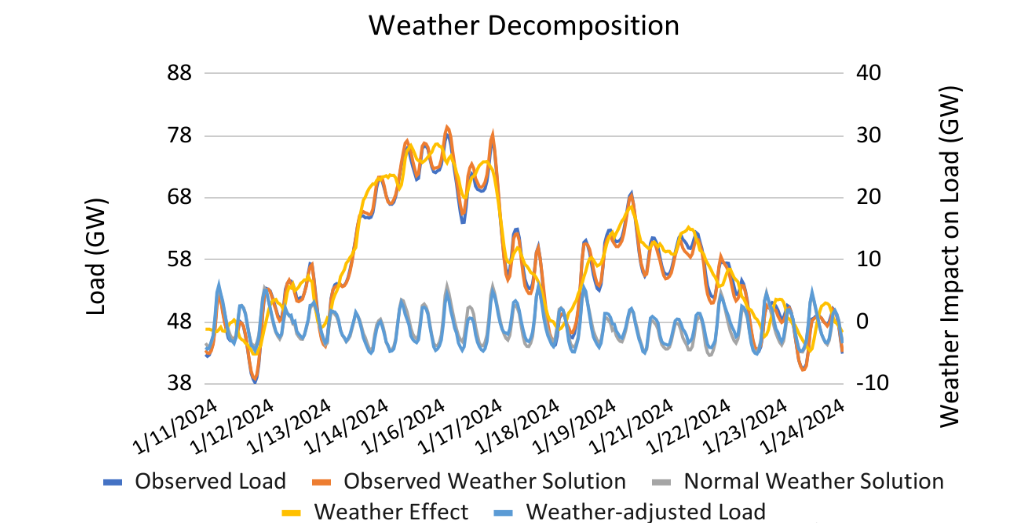
ERCOT Total Market
The dark blue line represents the observed load data, which ERCOT reported.
Our model showing the actual weather is on the red-orange line labeled “observed weather solution.”
Next, we can see the normal weather solution in gray. This is a good approximation of the base demand under more average weather conditions.
But we want to take it further.
The difference between the gray line, the normal weather solution, and the red-orange line, the observed weather solution, is the yellow-orange line, the total weather effect. This is the load added by having extreme temperatures. On January 15 and 16, 2024, the load added due primarily to extremely low temperatures was more than 25 GW.
Now that we have our total weather effect, we can subtract that from the observed load to deduce the weather-adjusted load. We’re stripping out the model error, giving us the best possible estimate of base load demand. This is the light blue line on the chart above.
Our Electricity Demand Forecasting Solution in Action
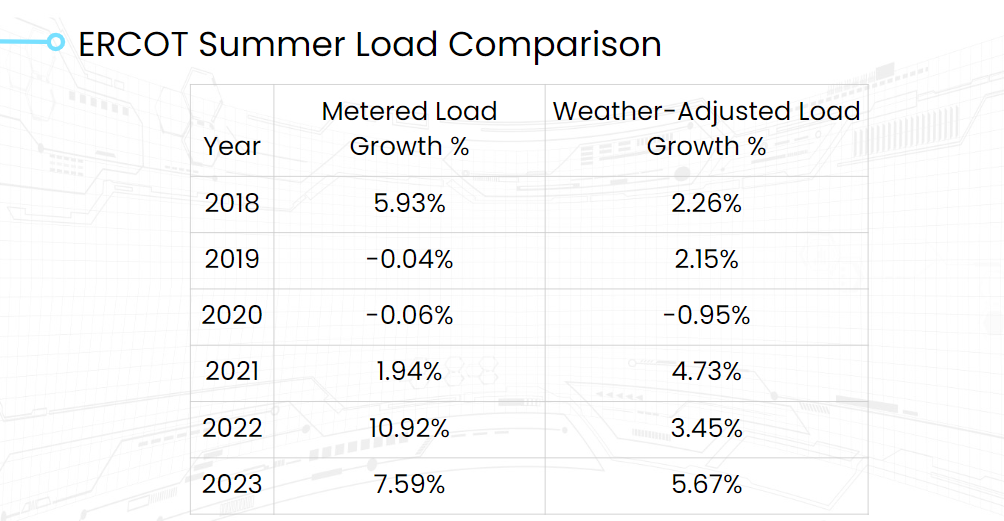
Returning to our original ERCOT example, we can see that the base load demand increased every year from 2018 to 2021 except for 2020 (during COVID-19 isolation policies).
When we strip the weather effect out of the metered load, the growth in year-over-year base load in 2022 and 2023 appears smaller. The weather-adjusted load in the 2022 and 2023 summers only grew 3.5% and 5.7% year over year.
We see a pattern of growth every year except 2020, but it’s a smaller rate of growth than the simple analysis of metered load showed.
Electricity Demand Predictions for Summer 2024
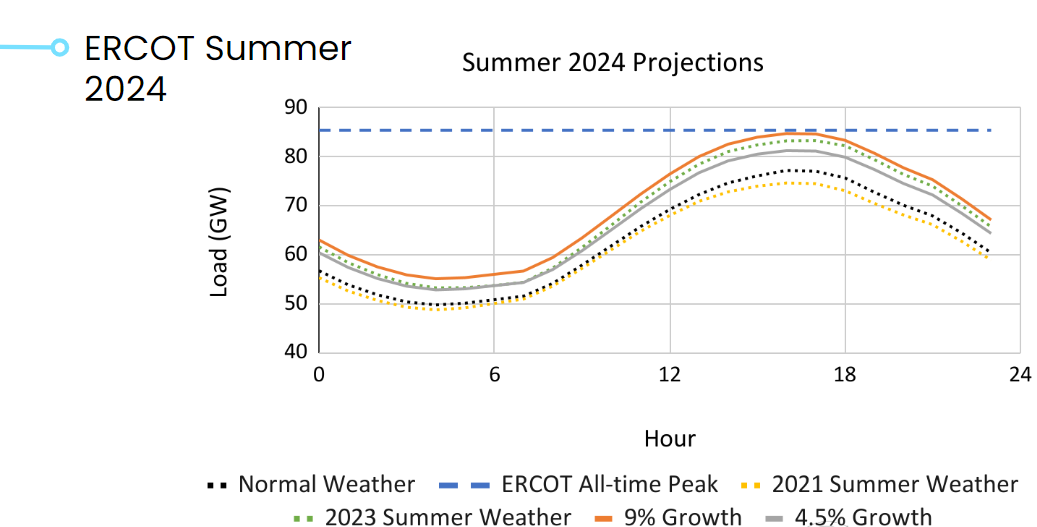
This information can help us to make more accurate predictions for summer 2024. Otherwise, if you fail to account for weather when analyzing demand growth trends, it’s easy to project an unreasonable load growth going forward.
The chart below shows the projections for summer 2024 if it’s a hotter summer like 2023 or more typical weather like summer 2021. It also depicts load if we assume a growth rate of 9% or 4.5% on the metered load from summer 2023, the latter of which is more likely based on our previous analysis.
Conclusion
If you want to track base electricity load trends, it’s important to adjust for the weather.
Looking at metered demand, ERCOT appeared to have massive base load growth in 2022 and 2023. However, after correcting for weather effects, the base growth was about half that. The only year that didn’t exhibit base load growth over the past six years is 2020, which can be explained by demand reduction because of COVID-19 isolation policies.
This leads us to our conclusion – if you don’t account for weather in your past electricity demand analysis, you can be off base in future projections.
Yes Energy's Weather Decomposition Tool can help you make more accurate projections by stripping away the effects of extreme temperatures on electricity demand. Ask our team a question or request a demo to see this tool in action.
Want more details on how this works? Tune into our on-demand webinar, Using Weather-Adjusted Load to Track Market Demand Trends. Sign up to watch it now!
About the Author: Ben Perry is the senior product manager of forecasting at Yes Energy. Ben brings 10 years of experience as a power demand forecast analyst to the Yes Energy product team. He's now focused on applying that experience to steering the Yes Energy forecasting product roadmap to best serve the industry through the energy transition.
