


Share this
by Joanna Cloud
Let's talk about an energy resource planning horizon, whether you’re a long-term trader, asset developer, utility, or regulatory agency.
In this blog, we’ll focus on intermediate to long-term energy forecasting and how you can employ it to make better decisions. This could include making large capital decisions for infrastructure or entering into power purchase agreement contracts or fuel budgeting contracts.
What Does Energy Forecasting Software Like This Do?
The EnCompass model is a single software process that co-optimizes all resource types across requirements for capacity, environmental programs, energy, and ancillary services.
It looks at the fundamentals of the power marketplace, such as:
- Where are the resources, and what kind are they?
- What are their operating characteristics?
- Do they have heat rates?
- Do they have forced outage rates?
- Do they have different fuel blending characteristics?
- Do they have storage?
EnCompass is a mathematical simulation model that allows you to forecast market conditions, resource operations, and prices.
For example, you can model how much solar power is entering this market in the next 10 or 15 years and how that changes market dynamics. You can also look at how your portfolio might respond to a variety of uncertainty variables.
Additionally, you can control the results of the forecasting model, so you can stress-test it.
Who Can Use This Model and How?
Currently, investor-owned utilities, electric co-ops, and power planning districts across North America use the EnCompass model. Regulatory agencies also harness its capabilities.
For example, several US states have requirements for electric utilities to file plans with state regulators that detail how they'll serve demand in the future. Utilities use EnCompass to simulate their load forecasts, load growth assumptions, and current asset portfolios to see how to serve load reliably. This may translate into a consumer rate increase because of rising business costs or the utility may need to update infrastructure.
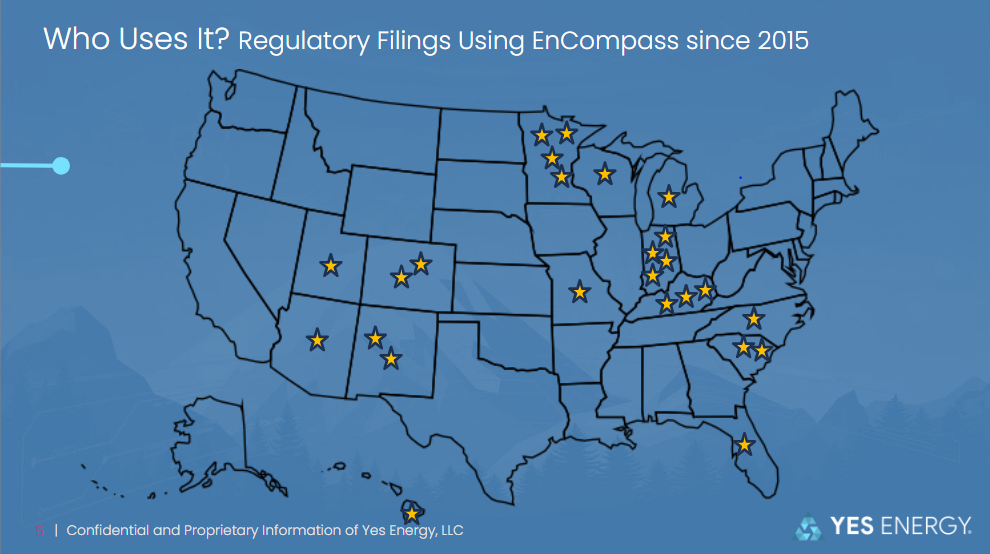
Each star on this graph represents a regulatory filing that has taken place in the last few years using EnCompass as the energy forecasting software.
In each of these filings, you have a regulatory agency, utility, and many other parties such as citizen advocacy groups. They may each have competing agendas, but what they have in common is they can all use EnCompass for long-term energy forecast modeling.
How Does This Energy Forecasting Model Work?

This model is a mathematical program that is either a linear program or a mixed integer program, which is a fundamental assessment of the marketplace. You can feed it different data items, such as transmission constraints (shown on the chart above).
(In another blog, we looked at the actual bus and branch level of detail. However, when we do long-term energy resource planning, we simplify to a zonal representation. As you go further ahead in time, there are so many unknowns, uncertainties, and decisions that you have to make computationally that you can't fit it all in at the nodal level.)
Next, you can add in the existing fleet of assets and load growth, including things that could be changing in load. For example, we have large, flexible loads coming online, more distributed energy resources, and microgrids changing the way our traditional load shape is handled.
Environmental policies are another significant factor in forecasting. You may try to meet a restriction or tax or want renewable energy to serve a certain proportion of the load. In that case, you can incent those types of technologies to serve load from a mathematical standpoint to get them to show up as a build pattern.
Next, you can take into consideration the new resources that are in the queue right now and the projects that are likely to happen. This includes answering questions such as:
- What are the different capital technology types and what are their characteristics?
- Are there cycling limits?
- What are the capital costs?
- Is there a production or investment tax credit associated with it?
- What are we trying to do from a reserve margin standpoint?
- How are we maintaining reliability on this particular system?
You can access this information from Yes Energy’s Infrastructure Insights Dataset, which provides comprehensive insights on the queue of planned generation, transmission, and distribution. All of this data comes together, and then you feed it into a mathematical engine and run the optimization. The forecasting model calculates geographical footprint points, and it prices out the cost to serve demand at those points.
An Example of North American Energy Forecasting
Let’s see how this actually shakes out.
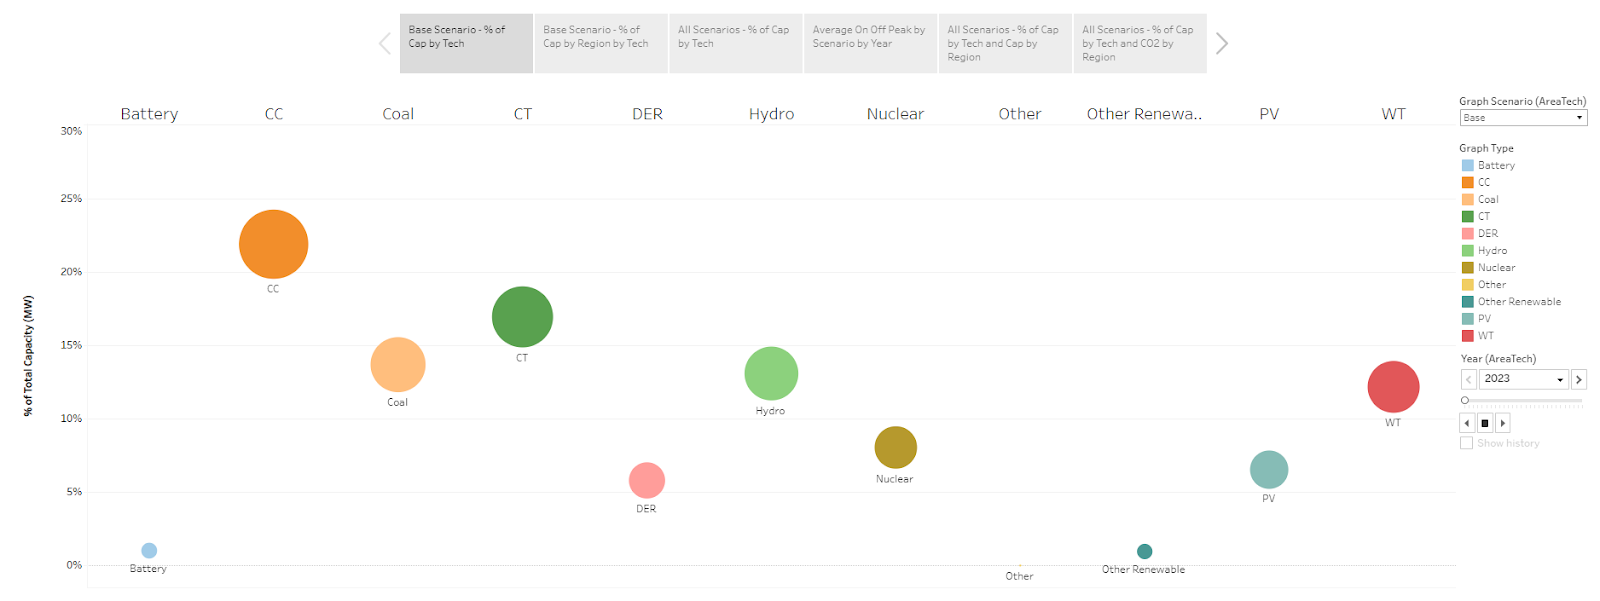
The chart above represents our current situation and shows all of North America by technology type and different technologies. Today, coal is running at about 14%, solar is at about 6%, and wind is about 12%.
Fast-forward with modeling:
You'll notice, as we get further out, coal grows smaller, and by 2050, coal has stopped generating. We predict solar power is going to be close to 25%, and wind is going to be close to 20%. Combined cycles stay mostly steady through this timeframe. Nuclear power gets smaller and smaller, but it doesn't drop off the chart like coal does.
A Modeling of ERCOT in April 2050
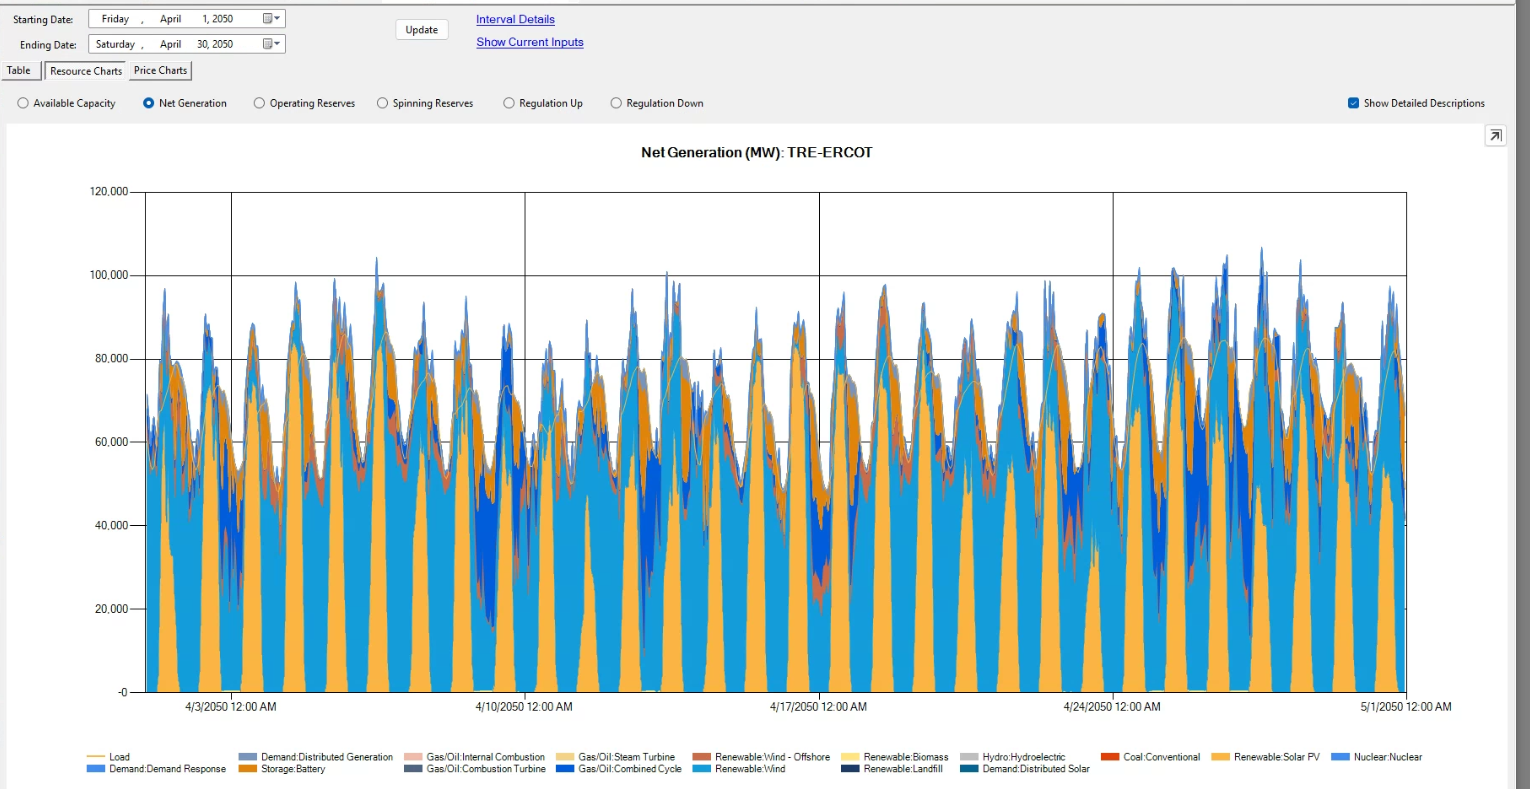
Source: EnCompass
In April 2050, we predict that solar and wind heavily dominate ERCOT, which is not surprising. However, because they are less consistent than other types of baseload generation, we're going to have more susceptibility to extreme weather events and more exposure to scarcity pricing measures.
 This particular chart shows the number of hours that ERCOT is forecasted to hit a scarcity pricing number.
You’ll notice there's sort of a cyclical pattern here, almost a sine wave pattern.
What's likely happening here is that we’re building renewables because they're cheap, but we have operational considerations that the renewables cannot satisfy.
We could hit some scarcity pricing that's probably going to incent some different types of technology, maybe some traditional thermal technology, that will bump those number of hours down, and then the pattern repeats.
We also have issues with breakaway pricing.
A Look at Breakaway Pricing Modeling
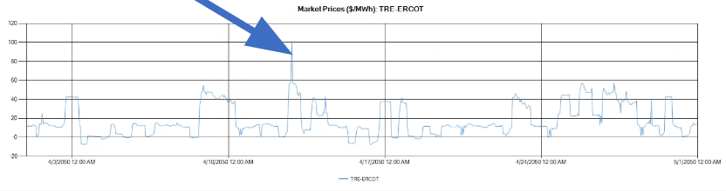 Source: Yes Energy EnCompass and Horizons Energy
This is an hourly chart of ERCOT prices over April. For the most part, prices bounce around in the same range, the $20 to $30 range. We have a couple of hours when prices dropped negative, with curtailment happening.
However, we have one hour where it gets really high, at 9 p.m. on April 12, 2050.
What's fascinating about scarcity pricing is that it's so difficult to see when you're looking at averages. If you're looking at ERCOT on-peak averages or off-peak averages, you don't see that one-hour spike because it just washes out with the average. However, that hour could be critical in terms of a portfolio and trade opportunity.
There are also increased opportunities in these types of markets for ancillary services.
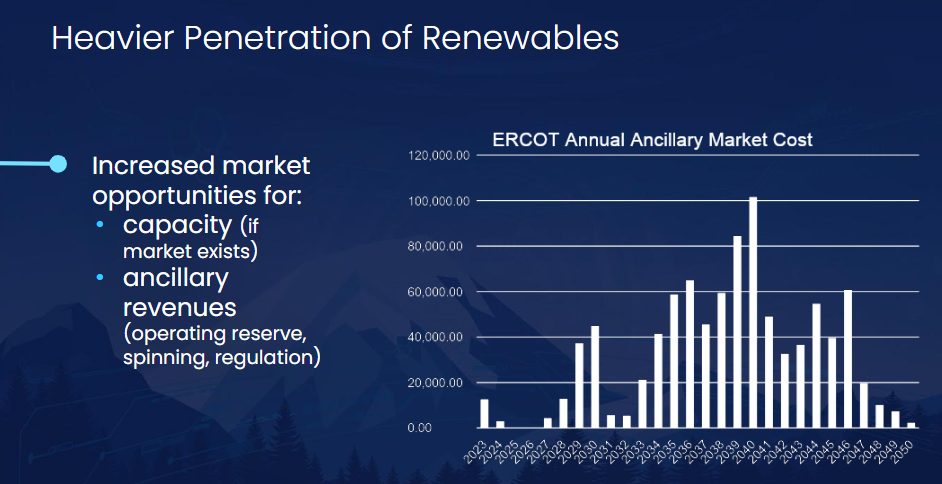
The chart shows the total market cost for serving ancillaries in ERCOT as a forecast.
It’s similar to the scarcity pricing chart and a bit cyclical. Again, what's likely happening is an increase in the number of renewable resources coming on the grid. They're not as capable of serving the ancillary need. So prices rise, and it incents a different type of technology that can serve those ancillary markets. Then, the prices come down and the whole pattern repeats.
So what does this mean?
How Do We Formulate a Strategy with Energy Forecast Modeling?
The key is to evaluate options in our existing portfolio and look at different products and services that we could have going forward and see how robust they are in a particular market structure.
This is how you can use EnCompass, for example, to evaluate a power purchase agreement under different types of risk conditions.
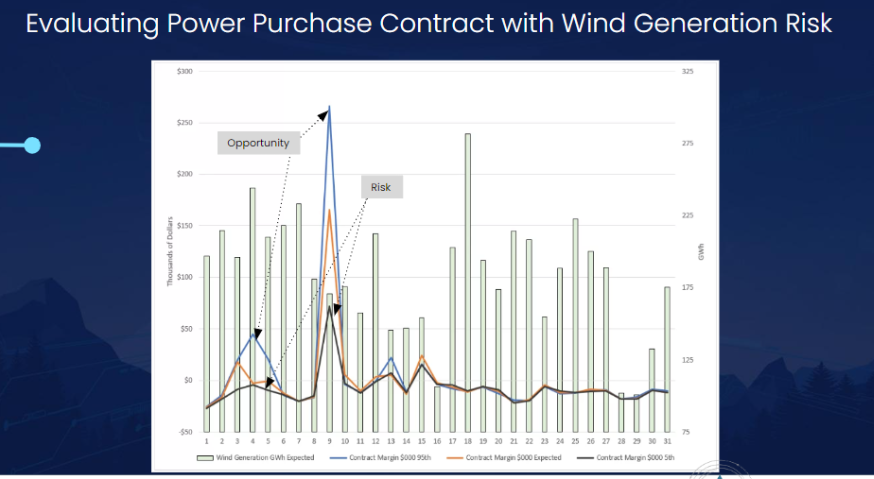
In the above chart, we have a wind generation risk that we’re evaluating – a 50 megawatt, all-hours PPA at about $50 per megawatt hour.
In just a couple hours, we have divergence between the orange line, which is our expected return, the blue line, which is our 95th percentile, and then the black line, which is our fifth percentile.
When we have divergence between the expected and the 95th or fifth percentile, that's our risk, and that's an opportunity in this particular contract.
Having this type of analysis opens up a whole host of probabilistic analyses. We can ask where this particular program or option puts us in terms of a risk profile commonly used for those types of long-term applications.
Yes Energy’s Encompass software enables you to calculate a margin at risk for any type of contract or resource in your portfolio. It also allows you to assess risk over a wide range of uncertainty variables to determine which uncertainties have the greatest impact on your portfolio, contract, or resource performance.
This is how you can not only Win the Day AheadTM, but win the month ahead, year ahead, or decade ahead.
Want to learn more about how to use an energy forecasting software? Tune into our on-demand webinar to hear more details about these metrics.
