


Share this
Explore the EnCompass model to predict future market conditions for asset development sites. In this blog, we'll focus on more short-term planning at the nodal level, and in our next blog, we'll explore intermediate to long-term resource planning at a zonal level.
Why Use Power Market Simulation Software?
EnCompassTM power market simulation software streamlines the siting process by forecasting maintenance needs, outages, and generation shift factors that influence power dispatch and locational marginal prices (LMPs). Our software illuminates market performance and potential grid reliability issues as well as provides detailed insights into generation capacities, service awards, and the profitability of assets – critical factors when it comes to selecting the right site for a project.
EnCompass’ simulations take into account a wide range of data including load forecasts, demand response, and transmission system data to predict market behavior. We assess energy storage, factoring in constraints and renewable sources, and use the Horizons Energy national database to support our analyses.
Our day-ahead (DA) power market simulations enable developers to make informed decisions about where to site their projects, ensuring they’re choosing a viable and profitable site.
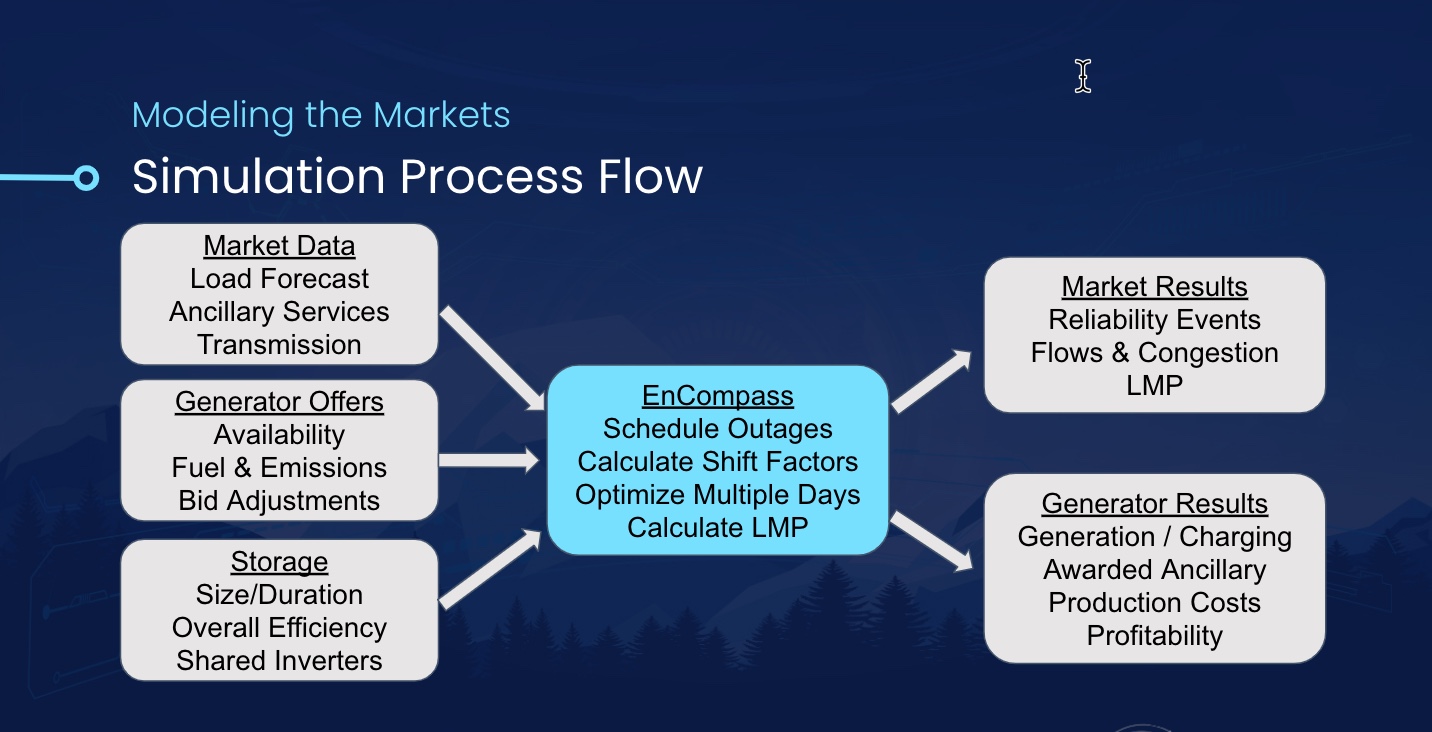
EnCompass’ simulation process flow
Explore a Battery Siting Case Study Using EnCompass Power Market Simulation Software
In the following two examples, let’s evaluate two potential 50 megawatt (MW), one-hour battery projects for 2025 in the Electric Reliability Council of Texas (ERCOT) with EnCompass:
- ERCOT South, Corpus Christi at the 138 kilovolt (kV) Santa Cruz substation
- ERCOT West, Odessa at the 138 kV Holt substation.
1. Identify Points of Interconnection.
Let’s start by considering the transmission lines that would support the project. PowerSignals® allows you to map surrounding locations and transmission corridors. With EnCompass, our flow diagram gives you a one-line diagram so you can see all the electrical connections.
In the image below, we see the Santa Cruz bus in the Corpus Christi project as it connects to the Nelson Sharp Substation in the Corpus Christi area. Nelson Sharp is a large substation that ties into the 345 kV system (shown in purple).
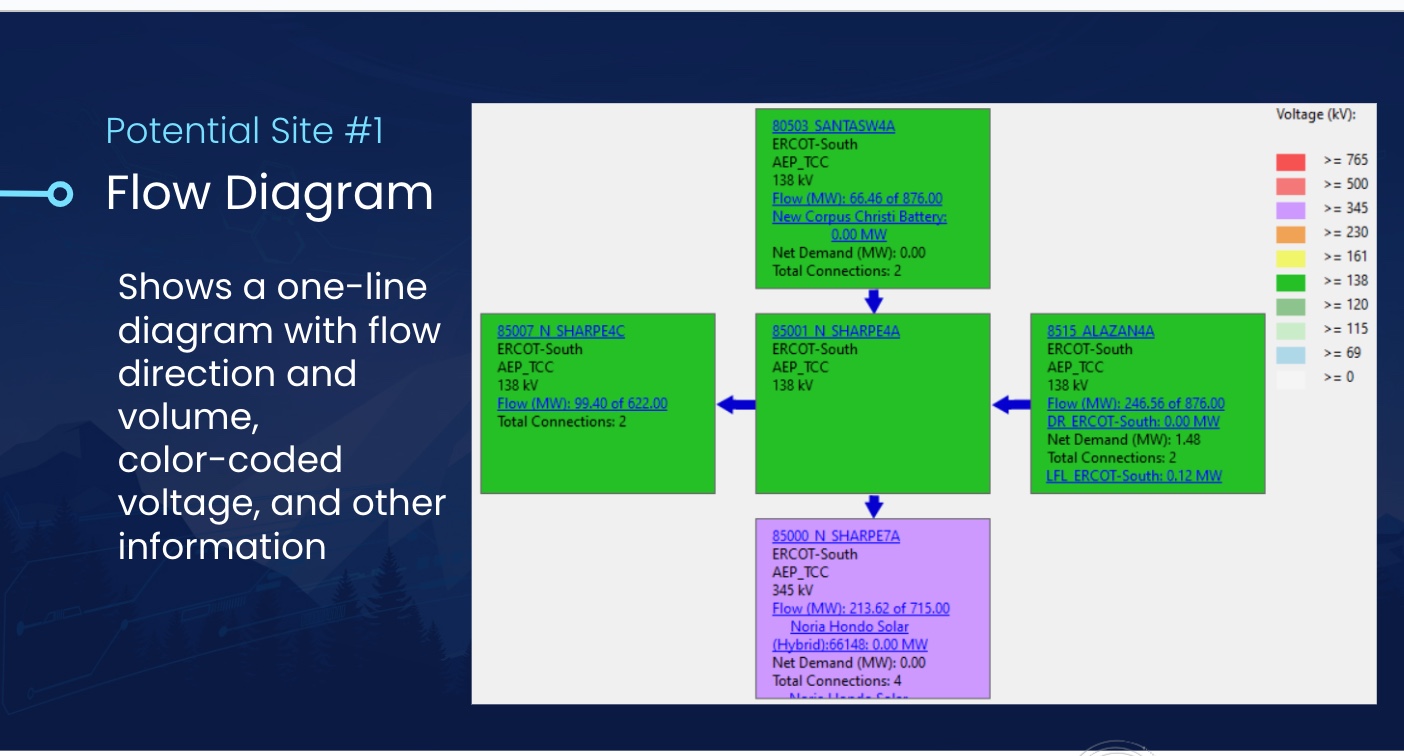
Source: Yes Energy®
We can then view individual projects at those locations. For example, the Noria Hondo project is a solar storage combination hybrid project currently in development and scheduled to come online in late 2024, tying into the 345 kV side of Nelson Sharp.
2. Evaluate Nearby Project Flows.
When we look at power flowing through the Nelson Sharp substation transformer, we can see which projects contribute the most flows – helping illuminate electricity and associated shift factors (which measure a specific location’s effectiveness relative to the change of power flow on a specific constraint) close to our potential project.
In the image below, we see the Corpus Christi project with a 68.2% shift factor, meaning nearly two-thirds of the flows from our projected battery would travel through that transformer onto the 345 kV system. There's a wind project with the exact same shift factor – Santa Cruz is on a radial line and Chapman Ranch Wind Project is behind it – so it’ll follow the same path.
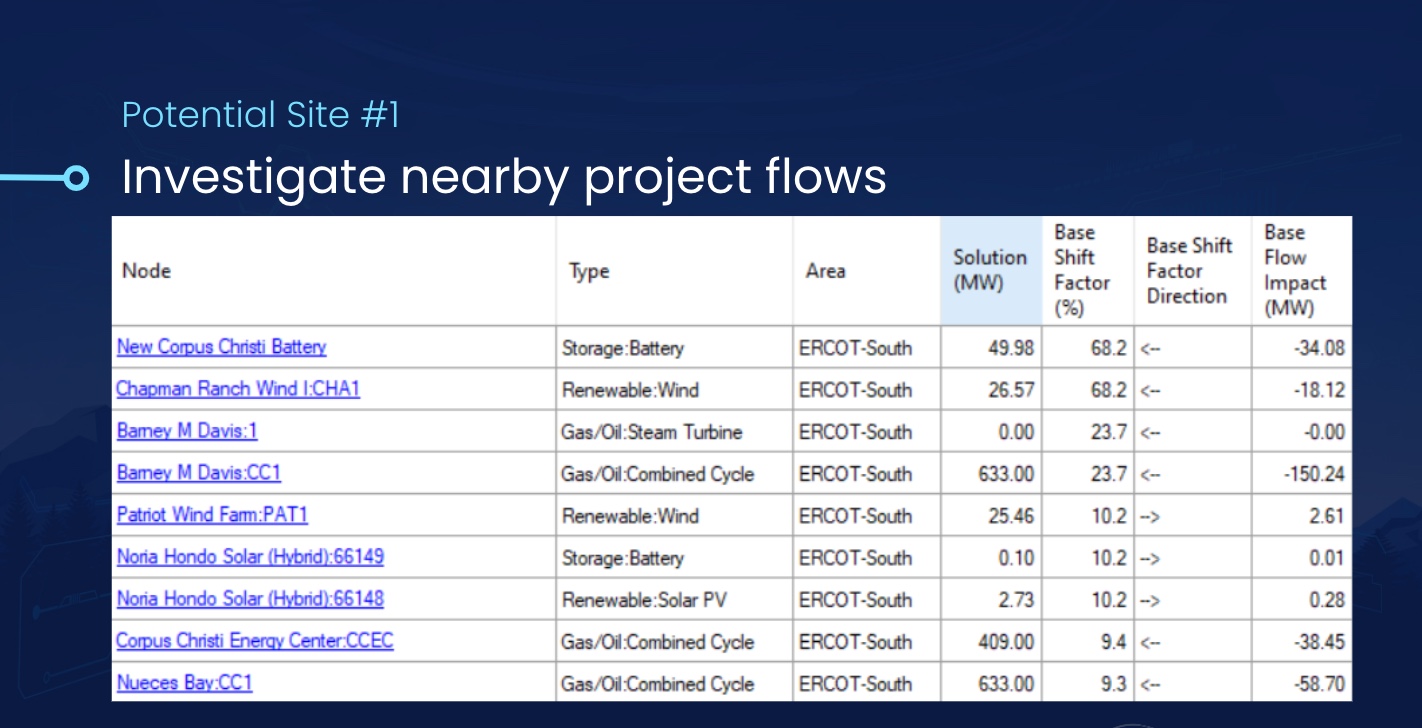
Source: EnCompass by Yes Energy
We can also see how other contributions will affect the flows, including large combined cycle projects that would flow along the same path as our potential project.
3. Determine Flow Impacts.
Let’s evaluate the Odessa project with a different view. In the image below, we focus on a specific hour and track the energy distribution from the Odessa battery, located at the Holt substation outside of Odessa. Our destination point is the source balancing authority – or, more broadly, the ERCOT load-weighted distribution bus, which aggregates the area's energy demand.
In the image below, you can see the energy flow from the Odessa battery, including significant contributions through individual transmission lines and substations like Gardendale and Moss. We also see critical flow paths, such as the West Texas export flow gate, which influences the distribution from Odessa. This helps us understand the electrical connections within the projected future transmission topology provided by the ISO.
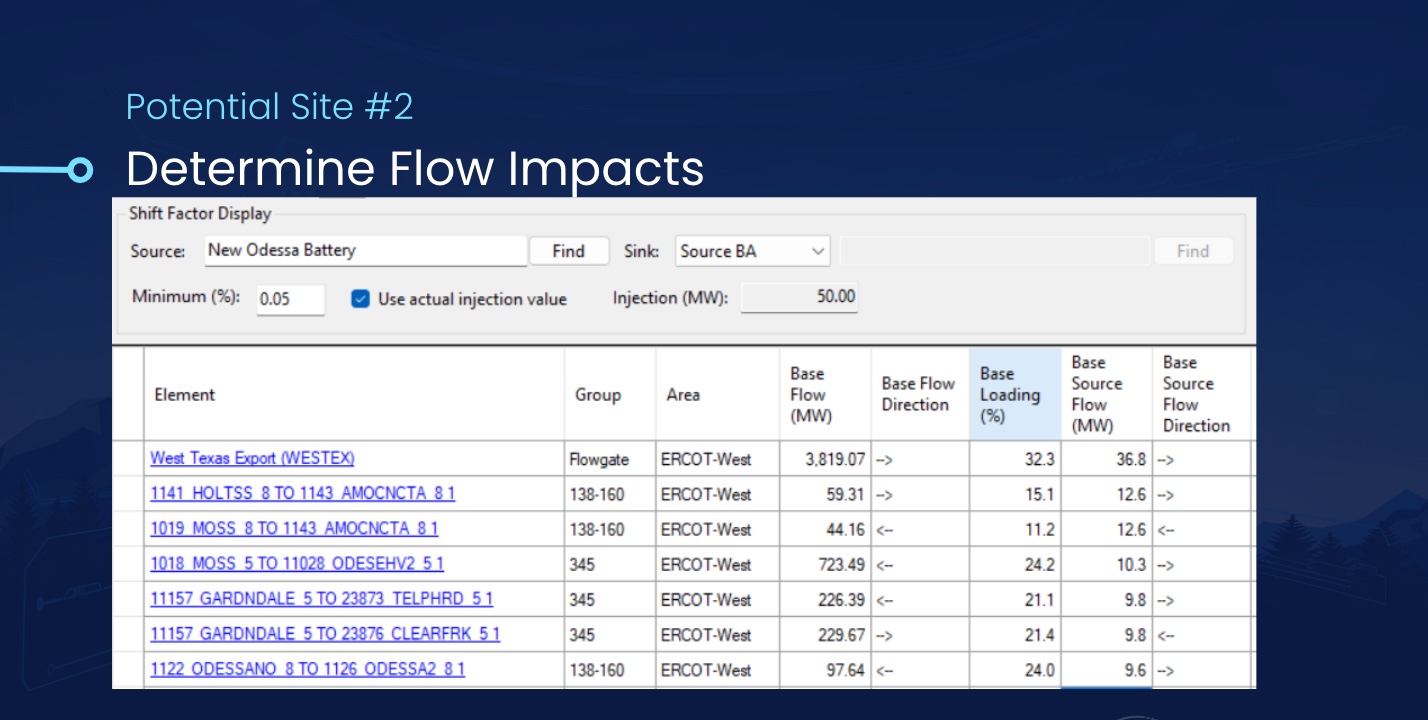
Source: EnCompass by Yes Energy
4. Compare Future Site Revenue.
In the image below, we ran the simulation again, analyzing every hour in 2025 to evaluate the performance of both projects, comparing the ancillary services, electricity generation, and energy requirements. Corpus Christi showed approximately double the usage compared to Odessa and, interestingly, had higher overall profitability — a departure from what historical and current analyses indicated.
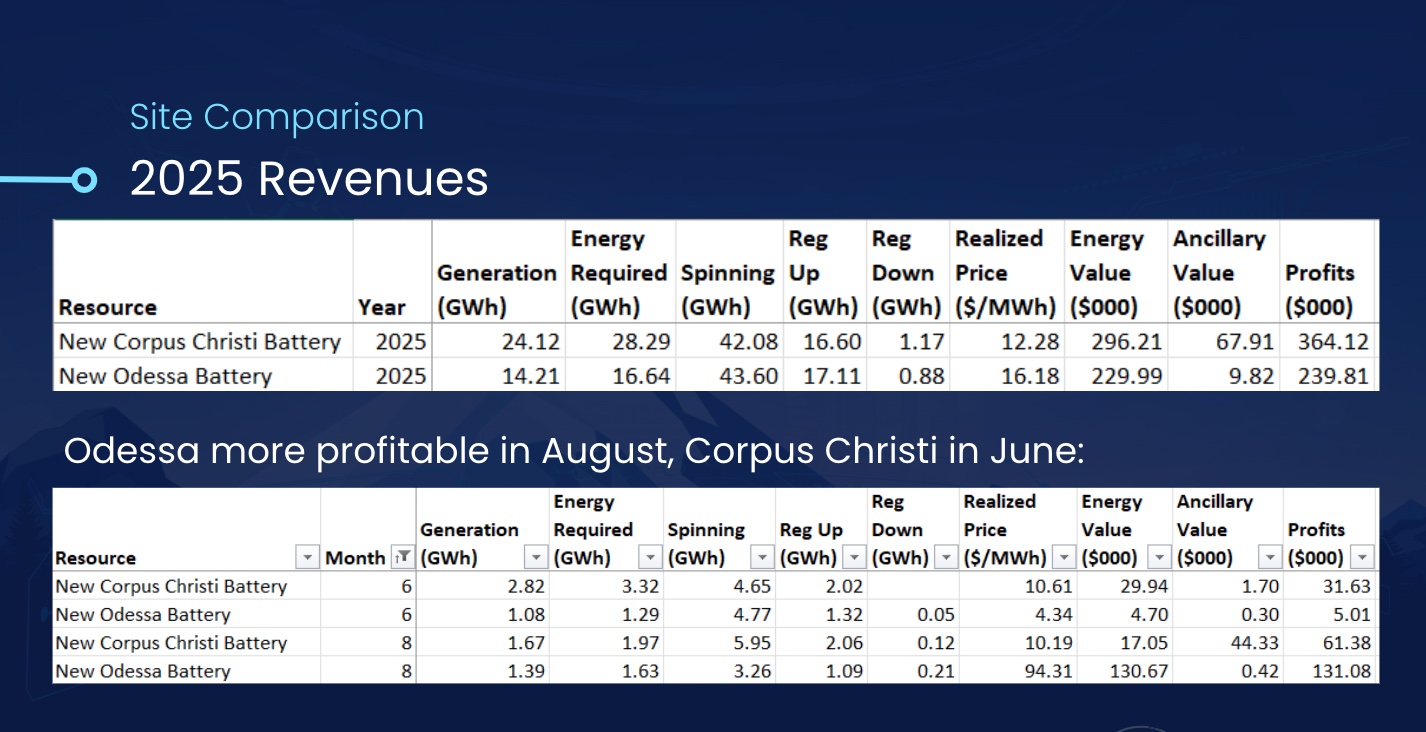
Source: EnCompass by Yes Energy
The role of awarded ancillary services, particularly important in ERCOT for storage resources, is central to this analysis. That’s because batteries must maintain a sufficient charge, which influences the timing of their charging and discharging schedules, to qualify for these services.
Next, we wanted to understand why we got a different result than what we saw using historical and current information, so we looked at the results for two specific months, June and August. In August, we found that Odessa's profitability nearly doubled that of Corpus Christi, while in June, Corpus Christi's project showed a slightly higher value. If we look at the other months, we see that August was particularly profitable for the Odessa project, while the Corpus Christi project was consistently strong in other periods.
5. Utilize Locational Marginal Pricing (LMP) Forecasting.
Next, let’s look at operations during those two months to see what’s actually happening.
We analyzed the hourly resource report for June 9 and 10 below. Our goal was to analyze one battery cycle to identify the highest and the lowest hours across that two-day period. The top image shows LMPs as seen on an hourly basis, while the bottom image illustrates the battery's charging and discharging activities.
The reddish-orange at the bottom of the chart represents the charging period, and we show that it's negative since it's a load requirement. On this day, the prices nearly dropped to zero, indicating an optimal time for charging the Corpus Christi battery. Once fully charged, we can then provide ancillary services, shown in blue. Gold is when we discharge, and we picked the hour with the highest LMP.
In this case, the cycle was actually across two days. This means this type of modeling can also help us piece together what might happen in a multi day strategy. In this case, the Corpus Christi project charged up in the early afternoon on June 9 with lots of excess solar generation and received some ancillary services. However, the values were low, which didn’t add up to much in revenue. When we discharged the next morning, prices got high.
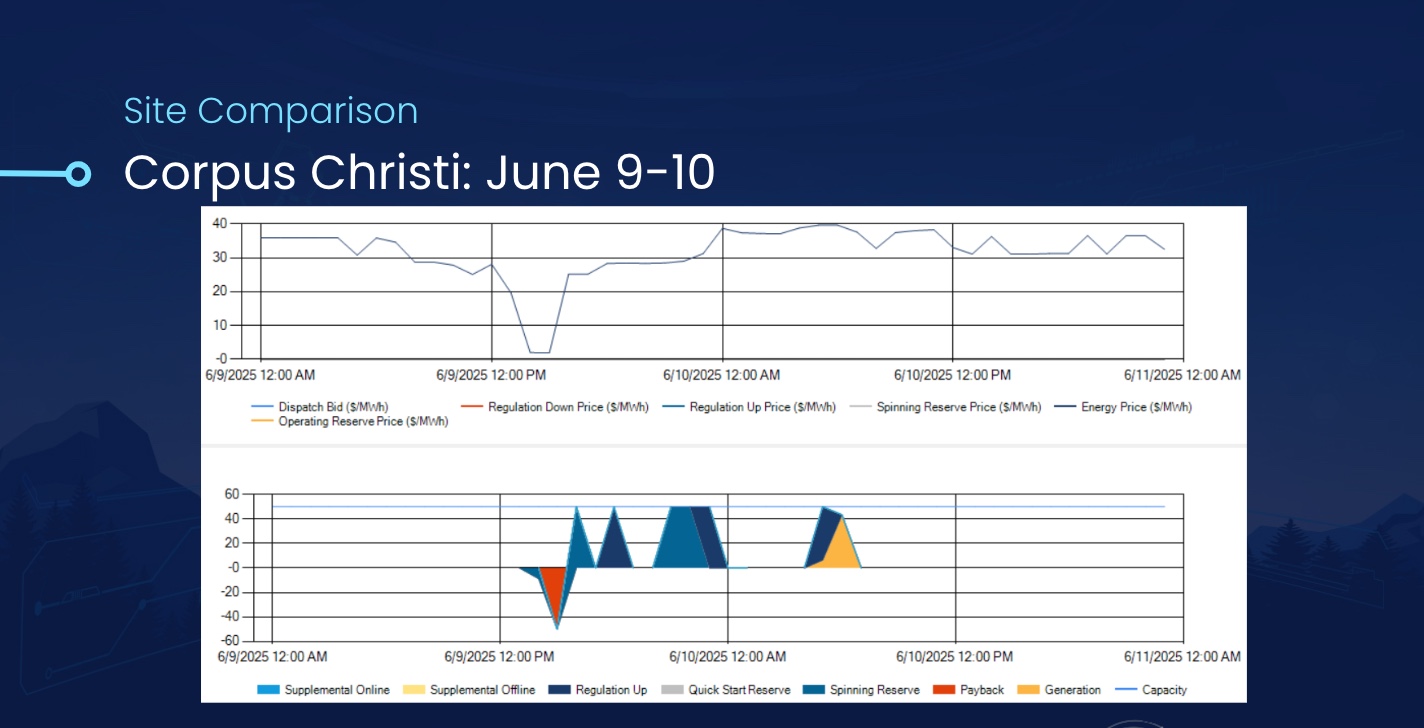
Source: EnCompass by Yes Energy
In the screenshot below, we analyze the Odessa battery for the same two days in June. The top image shows prices that are significantly higher than Corpus Christi, ranging from $40 to $55 per megawatt-hour, which aligns with current market trends. In this case, we see a very different charge and discharge schedule, typically completing one cycle a day, albeit with some irregularity.
The key focus here is on the price spreads. While the price spreads might appear similar, the higher operating costs due to the battery's inefficiency require these spreads to be wider to maintain profitability.
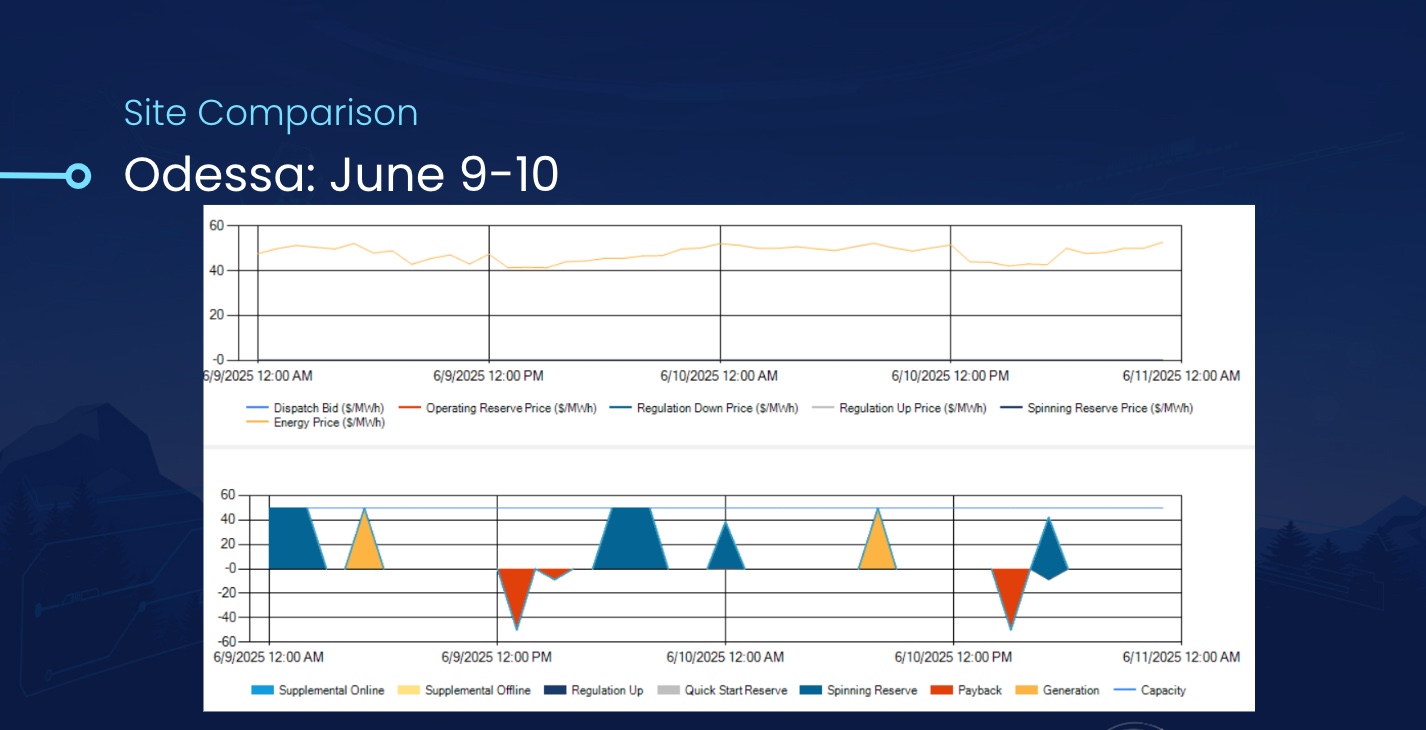
Source: EnCompass by Yes Energy
Now let’s evaluate August 15 and 16 in Corpus Christi (see below). In the top image, we have an LMP that goes above $100/MWh. A bit below that is our responsive (spinning) reserve price, which rose to about $90/MWh. Because ancillary services are co-optimized with energy, this was the key driver behind the LMP reaching $100/MWh in the Corpus Christi area.
In this instance, we charged the battery before the event occurred. Instead of discharging when the price rose to $100/MWh, we kept the state of charge to receive a full ancillary service award – in other words, to get the $90/MWh for the responsive reserves – and instead discharged a bit later to capture energy arbitrage value.
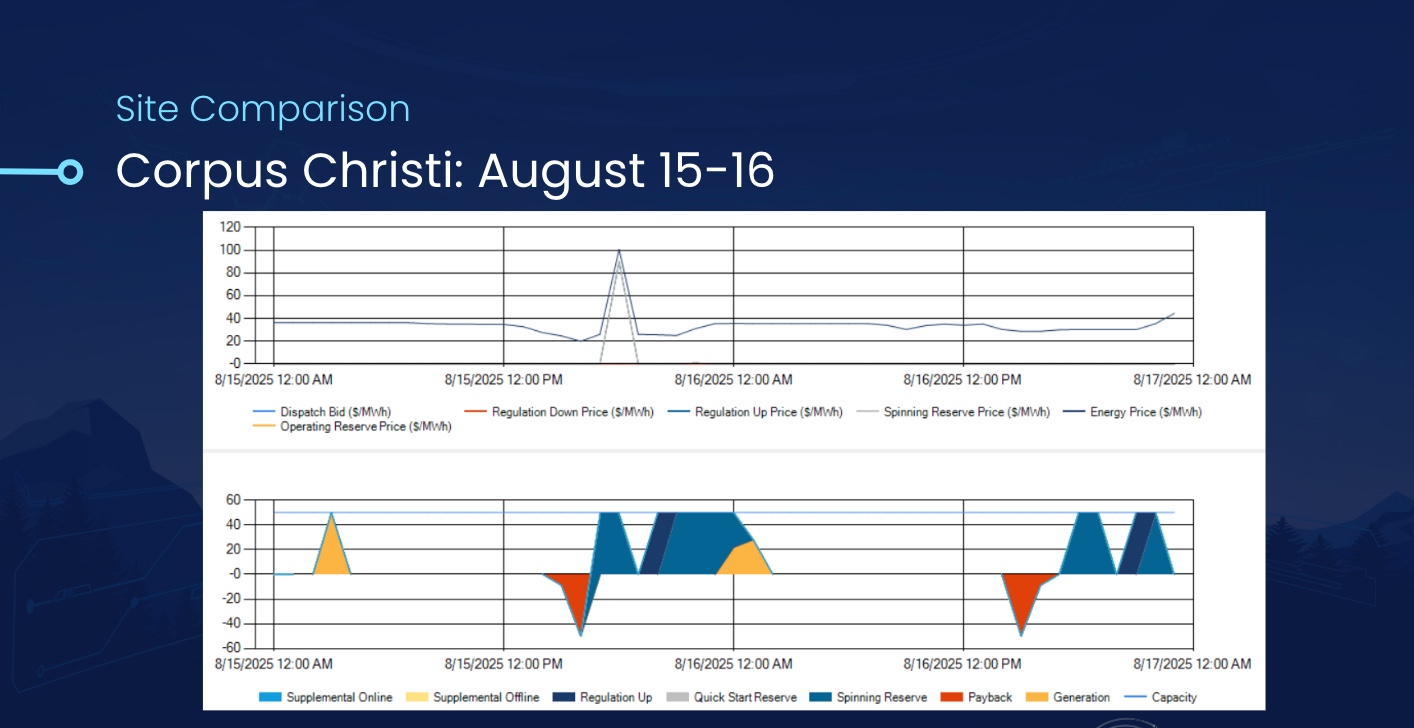
Source: EnCompass by Yes Energy
Next, we look at these same days in Odessa. In Odessa – as well as for most of ERCOT – we saw an extreme LMP event when we reached nearly $1,000/MWh. We still have the same responsive reserve price because it’s not locational. In ERCOT, there's a single price for each ancillary service, so it’s also $90/MWh in Odessa. Since the LMP was so extreme, we decided to discharge (see bottom image) and take advantage of the arbitrage value.
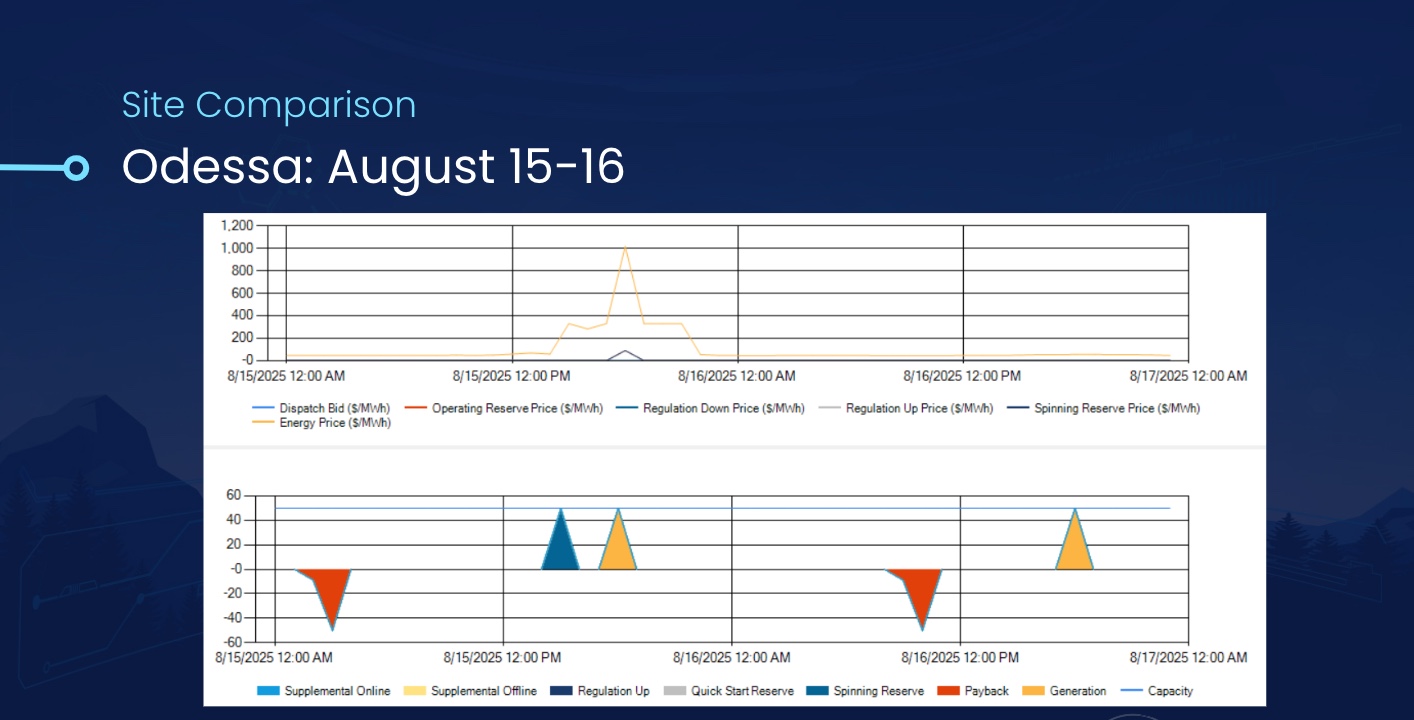
Source: EnCompass by Yes Energy
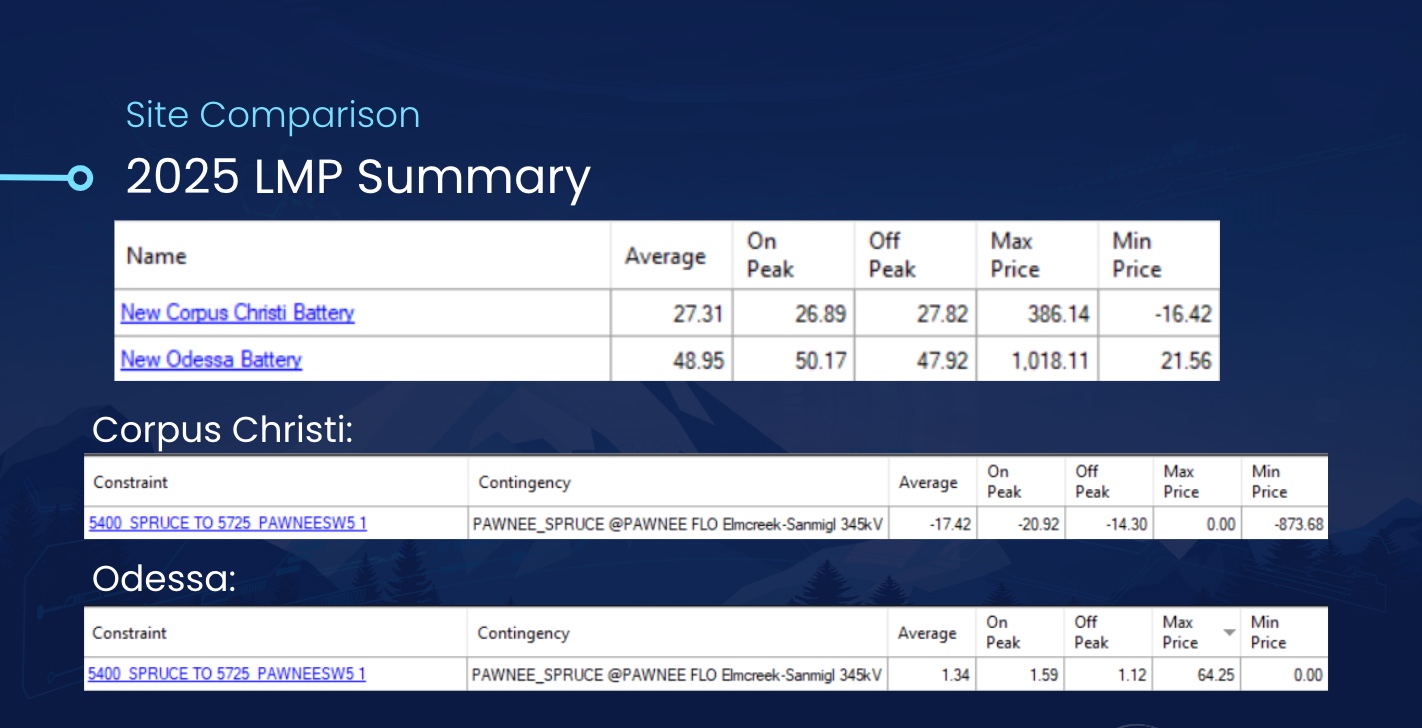
Last but not least, let’s consider an overall LMP summary (below) over the course of the year, looking at the average on-peak and off-peak hours, as well as the minimum and maximum prices at our two locations.
As mentioned earlier, this forecast essentially trends with what we saw in historical and current operations, with almost twice as much on an average, and an on-peak and an off-peak basis in Odessa as in Corpus Christi. We can then drill into what's driving historical and current prices, using the Yes Energy PowerSignals tools to analyze the drivers causing those LMP differences between these two locations.
Source: EnCompass by Yes Energy
Takeaway
Having a forward-looking price model is important in siting, as is having a model that can take into account the dynamics of your project.
EnCompass offers both.
Understanding how your battery might operate and then maximizing its revenues across energy arbitrage and ancillary services is a critical part of the asset-siting process.
EnCompass enables you to understand current market drivers, clarify how the project would perform once operational, identify key risks, and incorporate a forward-looking view and model. Incorporating these factors into your analysis is a critical step in the siting evaluation process.
Want to learn how EnCompass can help you Win the Day Ahead™.

