


Share this
by Leticia Gonzales, Natural Gas Intelligence on May 14, 2024
Yes Energy® partners with NGI to provide key power market indexes for buying and selling natural gas to effectively manage price risk and optimize operational efficiency.
In this blog, we’ll review activity in the natural gas market and examine the factors behind the steep decline in Henry Hub prices as well as address high demand in the growth of liquefied natural gas (LNG), increased power generation, and exports to Mexico. We'll discuss production levels and the notable growth in storage inventory surplus as it relates to supply, then analyze forward curves to predict when prices might rise.
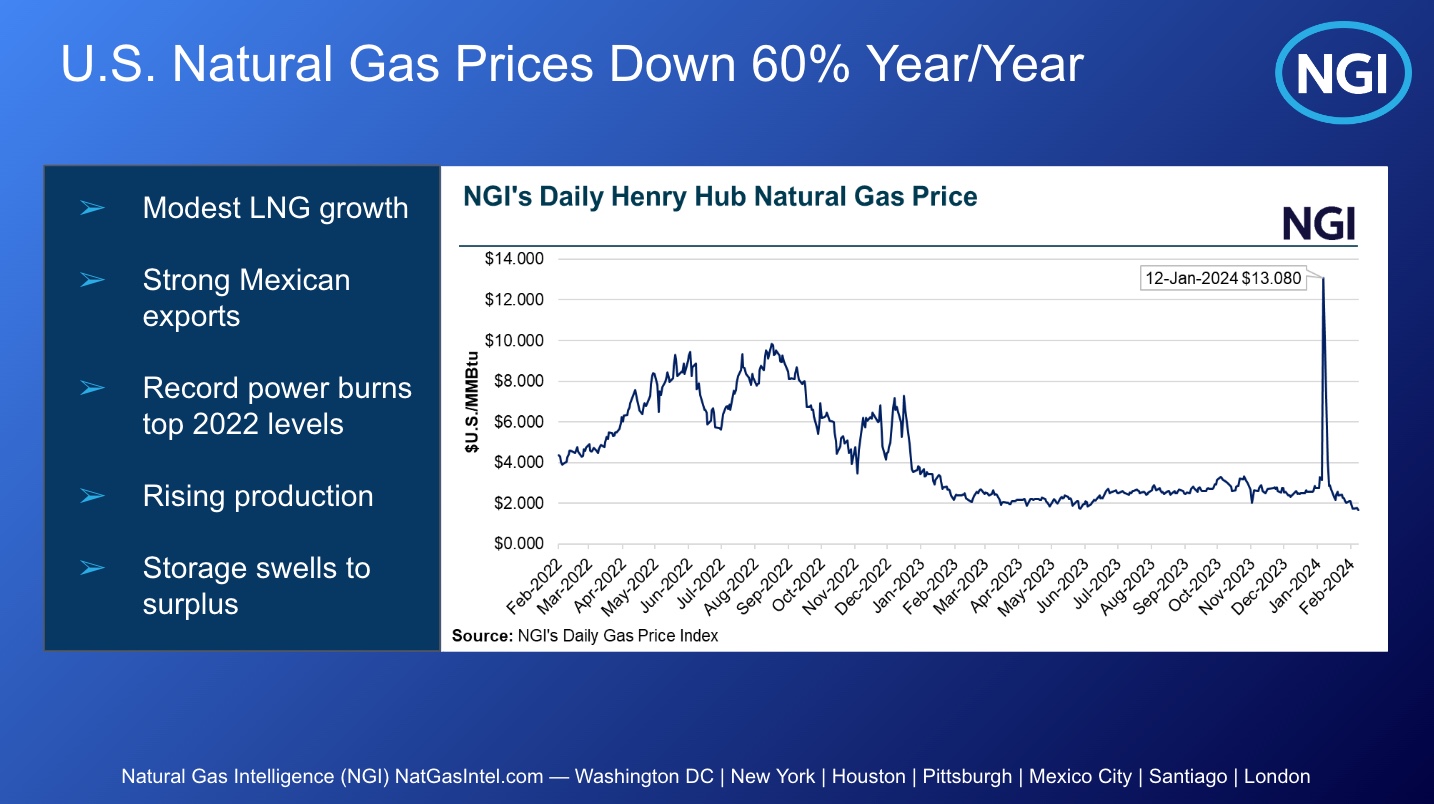
Natural Gas Price Trend Chart
A significant rise in production led to a sharp decline in prices during 2023. Despite growth in liquefied natural gas (LNG), increased exports to Mexico, and substantial power generation in the US, these factors weren’t enough to sustain prices.
The natural gas price trend chart below covers two years of daily gas prices, highlighting the volatility and the record highs in summer 2022 when Henry Hub cash prices hit $10/MMBtu. Prices have since fallen sharply, beginning early last year, largely because of a surge in production in 2023.
As the US has become the top LNG exporter, the market remains volatile in spite of the lower price environment. This year, prices dipped even lower than last, but we saw a brief spike to over $13 in January, resulting from winter storms and production issues. However, the prices fell again quickly, reflecting ongoing market volatility.
Liquefied Natural Gas (LNG) Market Trends
Next, let’s consider demand drivers.
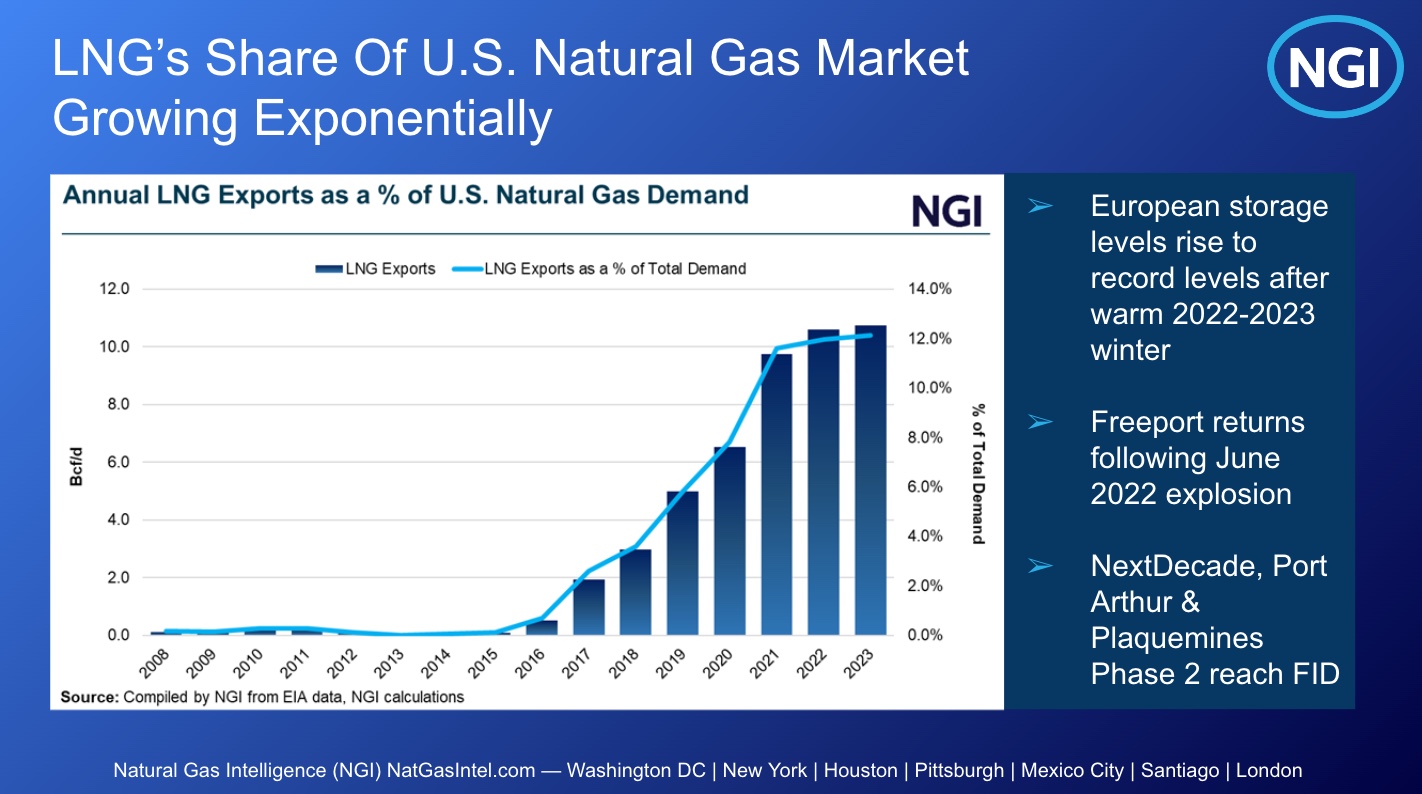
In the past decade, the US grew its LNG export capacity to 14 billion cubic feet (BCF) per day. In 2023, that growth was mainly because of the return of Freeport LNG after an outage, contributing an additional 2.1 BCF per day at full capacity. Outside of that event, LNG saw modest growth in 2023.
For 2024, we expect a slight increase in LNG growth, with no large projects coming online. Golden Pass LNG is expected to start at year’s end, but won’t export until 2025. Plaquemines LNG is also set to start later this year with a smaller, modular approach that will gradually contribute an extra 1.6 BCF per day.
Significant growth in LNG is projected for 2025 and beyond, especially in the latter half of the decade, with the start of major projects like Rio Grande LNG, Port Arthur LNG, and the second phase of Plaquemines LNG, which were recently approved. These will substantially increase demand in the coming years.
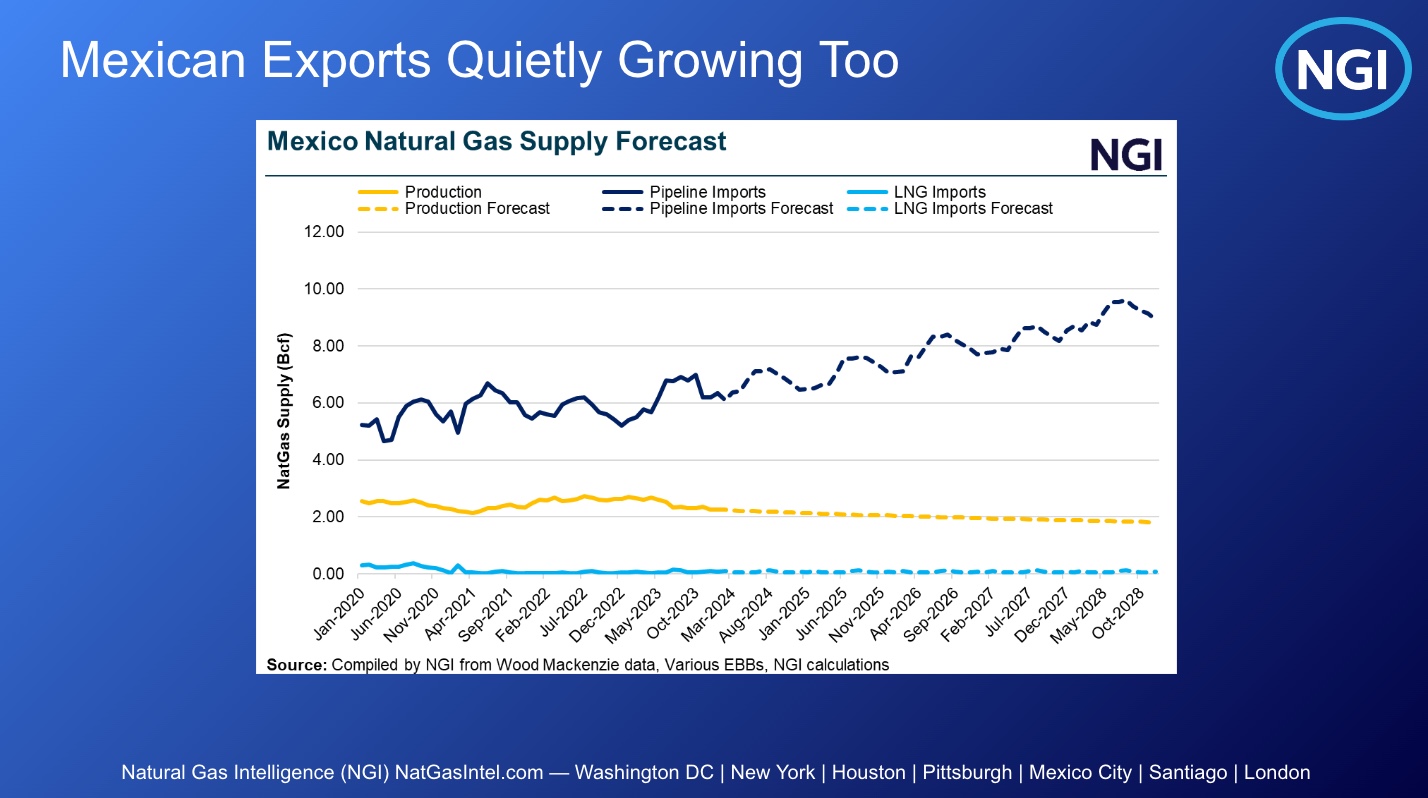
Mexican Natural Gas Exports Growing
Pipeline exports to Mexico, especially for power generation during peak summer demand for air-conditioning, saw significant growth this year. Since 2018, Mexican natural gas exports have increased by about 3% per year. In June 2023, we observed a record, with exports surpassing 7 BCF per day on nine separate days.
At the same time, Mexico’s energy sector is also expanding with its own LNG projects, some of which have already been approved. These projects are important for the US gas market because the natural gas used is often sourced from the US, particularly the Permian Basin and South Texas, which is then sent to Mexico for liquefaction and export to global markets.
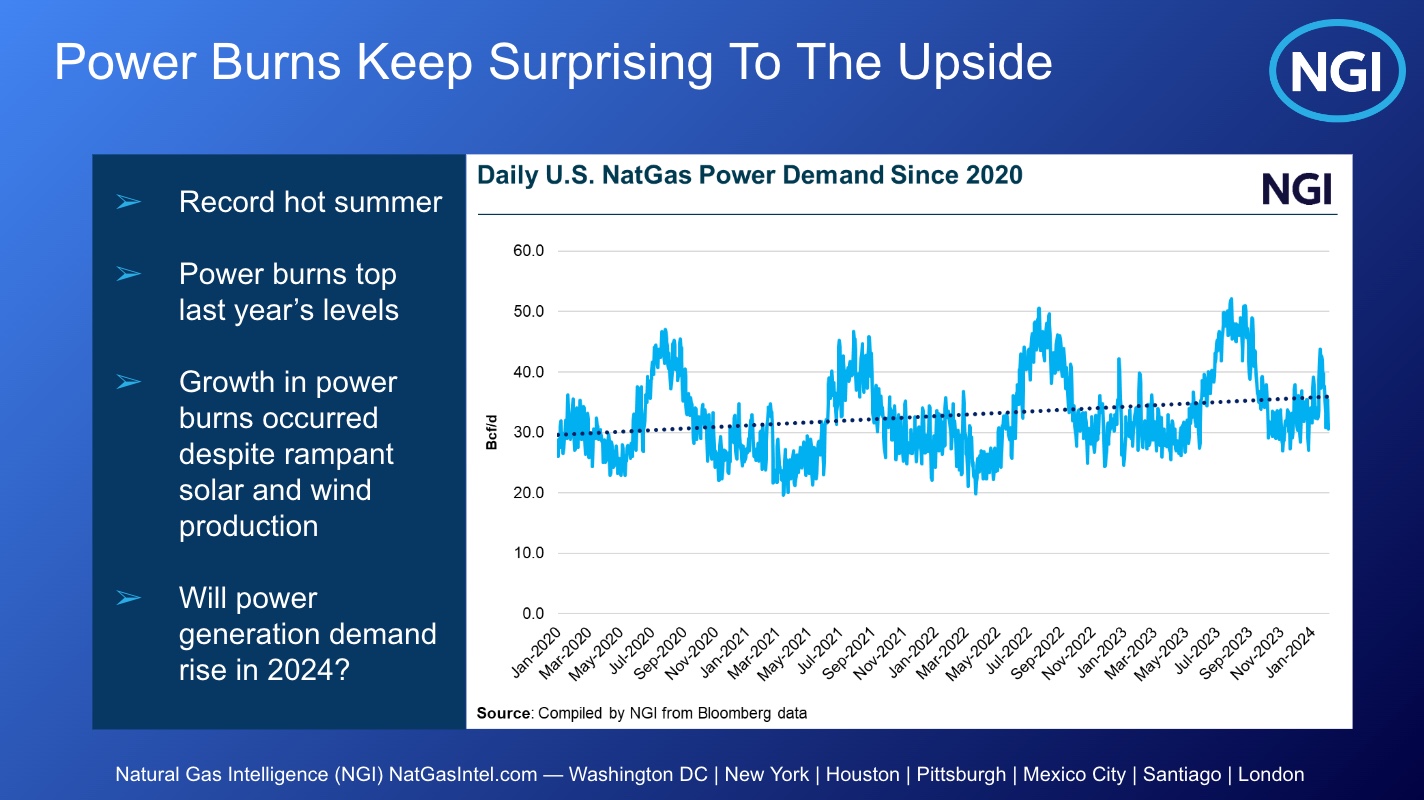
Power Generation from Natural Gas Increases
Power burn is the amount of natural gas consumed in the power-generating process over a particular unit of time. As we see in the chart below, power burns – power generation from natural gas – have increased over the past few years. Despite predictions of peak demand and the rise of renewables, natural gas demand for power has slowly but steadily increased to more than 35 BCF per day in 2023.
Producers that we’ve spoken with express optimism about continued strong demand for gas in power generation, which itself is expected to explode in the coming years thanks to data centers and other energy-intensive industries.
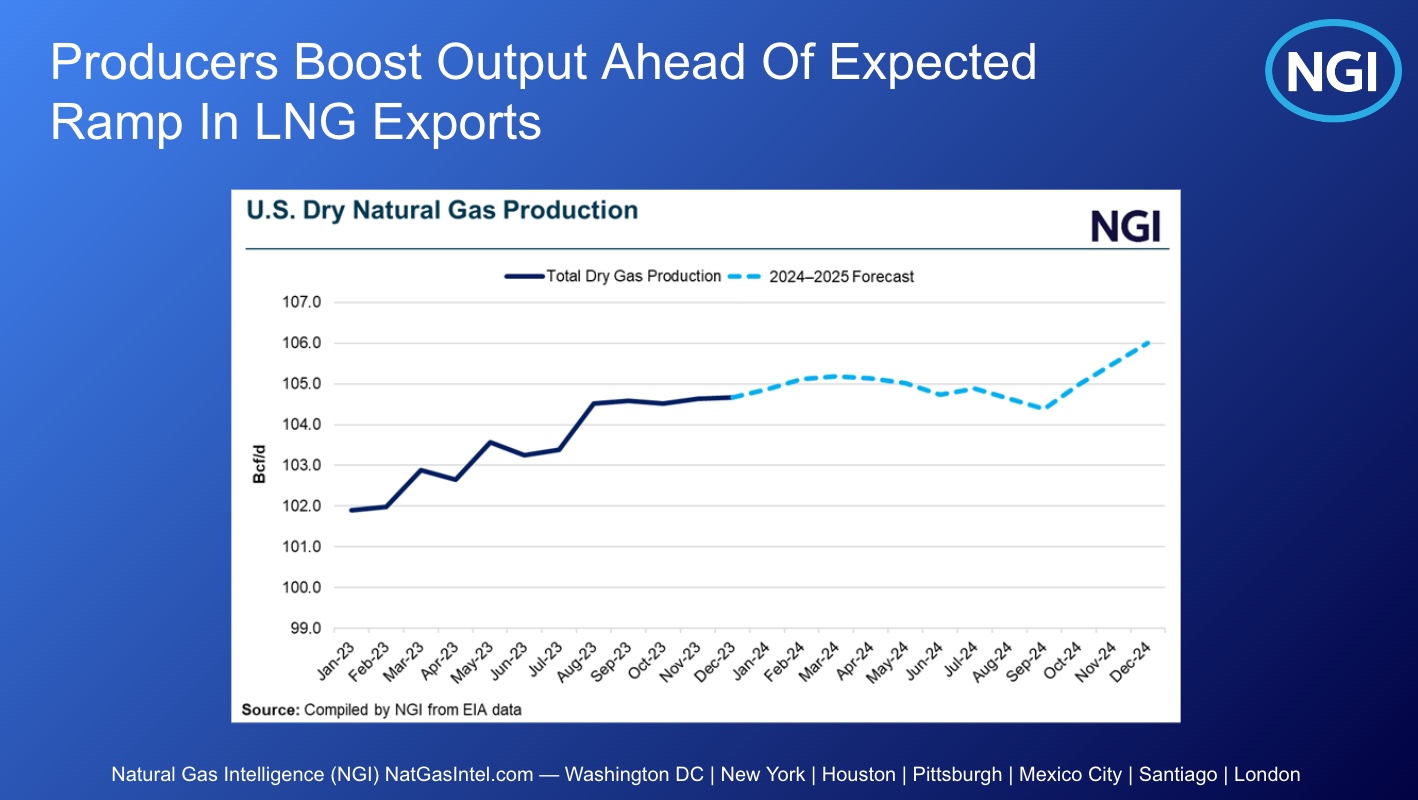
Production and Its Effect on the Natural Gas Market
Production is the main reason for last year’s significant drop in prices, despite unexpected strong demand factors. This production surge in 2023 was largely in response to the higher prices seen in 2022, following a typical four to six-month lag in producers’ responses to sustained price signals. There was a substantial increase in supply during peak winter demand by January 2023.
Another factor contributing to increased production was the anticipation of higher LNG demand in 2023, which didn’t materialize as expected. For example, the start of the Golden Pass LNG was delayed, with its first exports now scheduled for 2025. Despite projections of increased LNG demand and record power burns the previous year, producers flooded the market with new supply in response to the demand they expected to be in the market. Absent that demand, though, prices plummeted and the new supply had to look for a home elsewhere.
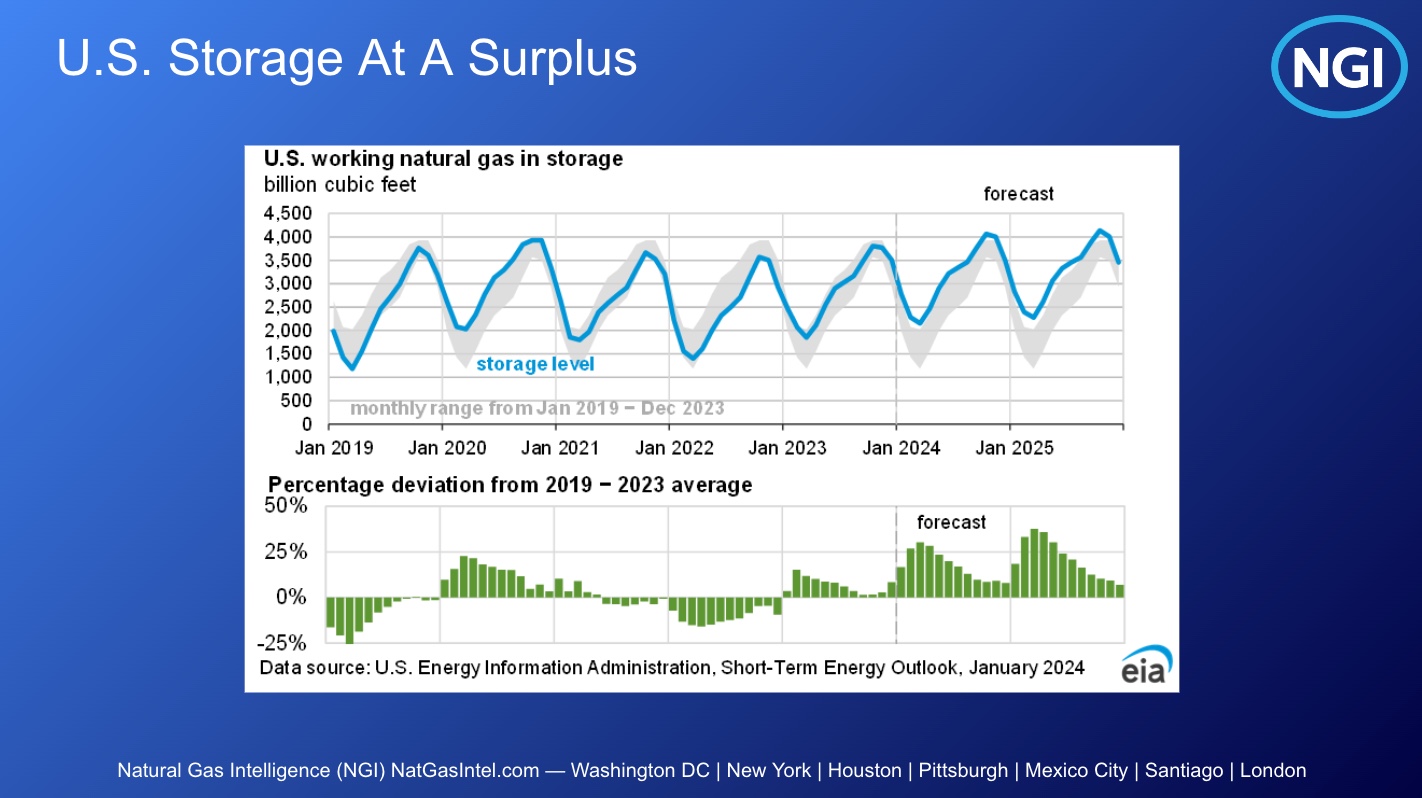
US Natural Gas Storage at a Surplus
The increased production led to US storage moving from a shortfall in 2022 to a surplus, which continued to grow during another mild winter. Inventories exited the withdrawal season at 2.259 TCF, 633 BCF above the five-year average. That surplus has continued to grow in the early part of the spring season, reaching 2.633 TCF as of May 10, 2024, which is 620 BCF higher than the five-year average. With yet another month of mostly mild weather in the forecast, the robust storage builds are likely to continue, keeping the pressure on prices, at least in the near term.
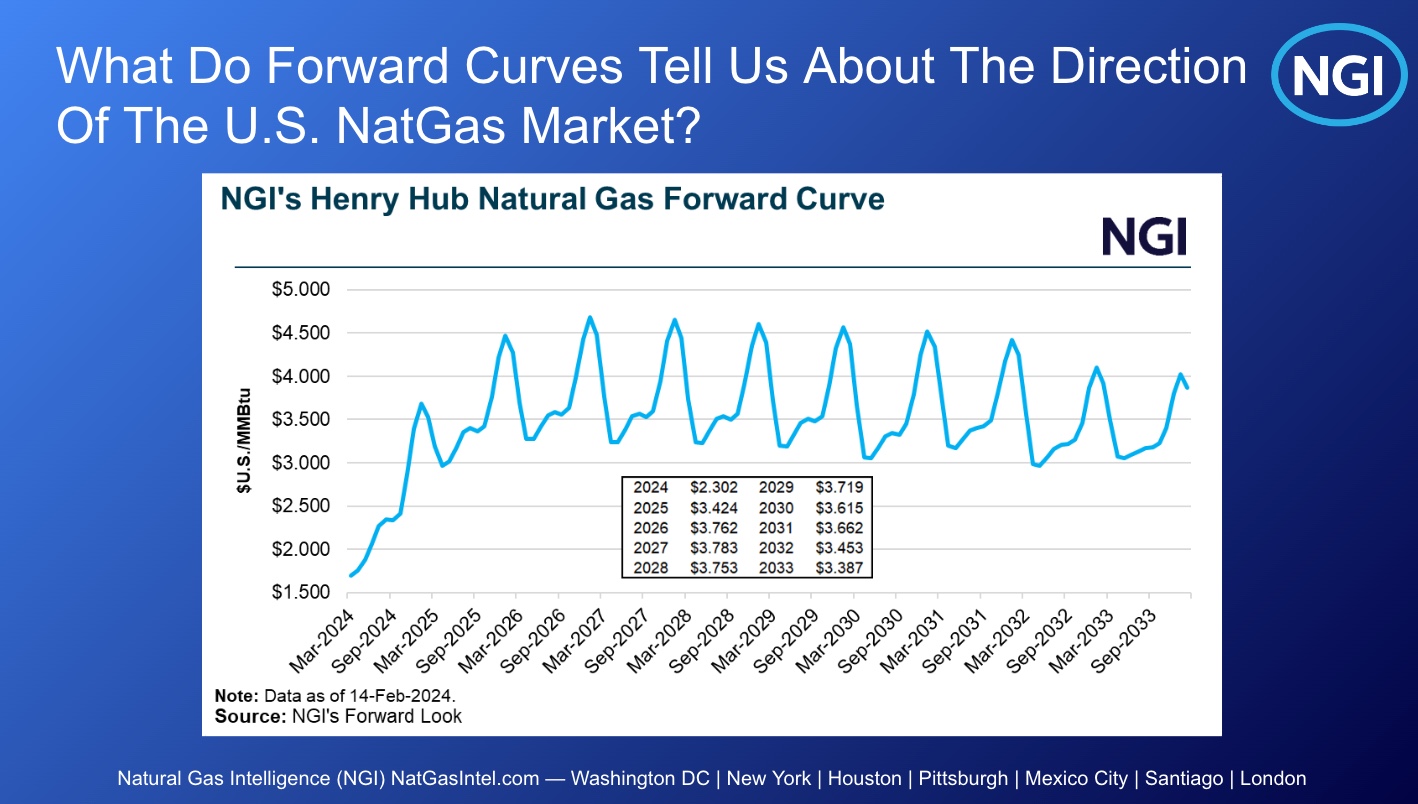
Natural Gas Price Trend Forecast
When we look at forward curves in natural gas prices, we saw a shift take place at the end of winter as producers began to announce changes to their activity in light of low prices. Chesapeake Energy Corp. announced a 20% capital expenditure reduction and a 15% production cut, with prices remaining low at the front of the curve but seeing an uptick in the latter months.
Chesapeake indicated it would drop rigs in the Haynesville and Marcellus, with other companies like Comstock Resources Inc. also adjusting their operations. These actions are pushing production estimates down and lifting prices. The June contract climbed back above $2 in early May, neared $2.50 by the middle of the month and had soared to $2.751 on May 21 before easing a bit the following day. What’s more, higher prices are seen in each month through January, when the contract reaches more than $3.80 based on the current forward curve.
Some companies like Range Resources Corp. are maintaining production, focusing on natural gas liquids to cope with low prices. EQT Corp. has cut back slightly but remains optimistic about the natural gas market, particularly for LNG and power burns. Overall, we expect bullish trends at least until 2030.
Looking at the forward curve below, and as noted above, we see higher prices on the horizon, potentially reaching $3 to $4 by the end of 2025, especially if a cold winter drives up demand. This price range is what we anticipate over the next decade, with normal price fluctuations taken into account.
Outlook for Natural Gas Prices and Associated Risks
Weather is the primary risk in the natural gas market, impacting both winter and summer seasons. This is especially true because the majority of new LNG facilities in the US are in the Gulf Coast, a region that’s prone to hurricanes starting June 1. For instance, past hurricanes have temporarily shut down facilities like Cameron LNG, significantly affecting the market.
Production also poses a risk. If demand unexpectedly rises and facilities are out of operation because of weather or maintenance, it could severely impact supply. We’ve observed slight dips in daily production which we can attribute to the maintenance season, and this is another potential risk to watch.
When it comes to regulatory risks, the Biden administration’s stance on LNG isn’t an immediate concern. However, any long-term export restrictions could affect about 9 BCF per day of LNG projects. Additionally, LNG facilities may extend outages, particularly when global prices are low, impacting both supply and demand.
The unpredictability of global events, as seen with Russia’s invasion of Ukraine, also creates risks. As the US becomes a more significant LNG exporter, international incidents can affect domestic demand.
At NGI, we continue to monitor these risks as we help you navigate the natural gas market.
Support for Your Natural Gas Market Needs
North American power markets are highly complex and data-intensive, requiring decision makers to constantly incorporate better data into their decision models. Natural gas in particular has a critical impact on electric power prices and trading decisions.
Yes Energy® partners with NGI to provide key power market indexes for buying and selling natural gas to effectively manage price risk and optimize operational efficiency.
NGI produces daily natural gas price indexes at over 160 North American locations and forward curves extending 10 years at 70 natural gas pricing locations. Subscribers to Yes Energy and the NGI Daily Gas Index get access to that data in their Yes Energy products for no additional charge.
Reach out to learn more about this partnership.
