


Share this
by Jake Landis
Renewable penetration is increasing across the U.S., and while this helps meet renewable energy targets, can there be too much of a good thing? An example of the challenges that increased renewables can cause manifested itself in the Southwest Power Pool (SPP) last week. Read on to learn about SPP’s record-breaking week, alongside an analysis of the event from Yes Energy’s Product Solution Expert, Jake Landis.
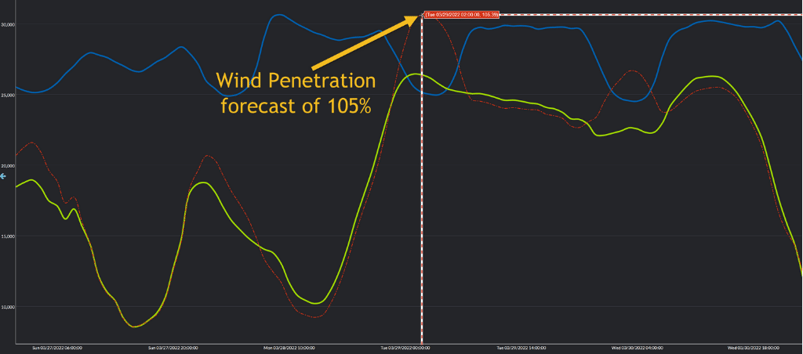
SPP recently produced a pair of records for wind generation statistics within the ISO. On the evening of March 28th, SPP posted a wind generation production record of 22,915 MW. The following morning of the 29th, wind generation accounted for just over 90% of total system demand. These stats eclipsed the previous, although short-lived, records set in February of this year.
However, the ISO was actually forecast to produce more than their total demand from wind. A calculation based on day-ahead statistics indicated wind generation would account for 105% of system demand, an impossible grid condition without large-scale storage solutions. In the chart below, you can see the load forecast (blue), day-ahead wind forecast (green), and the calculated series in red showing the wind penetration as a percentage of system load.
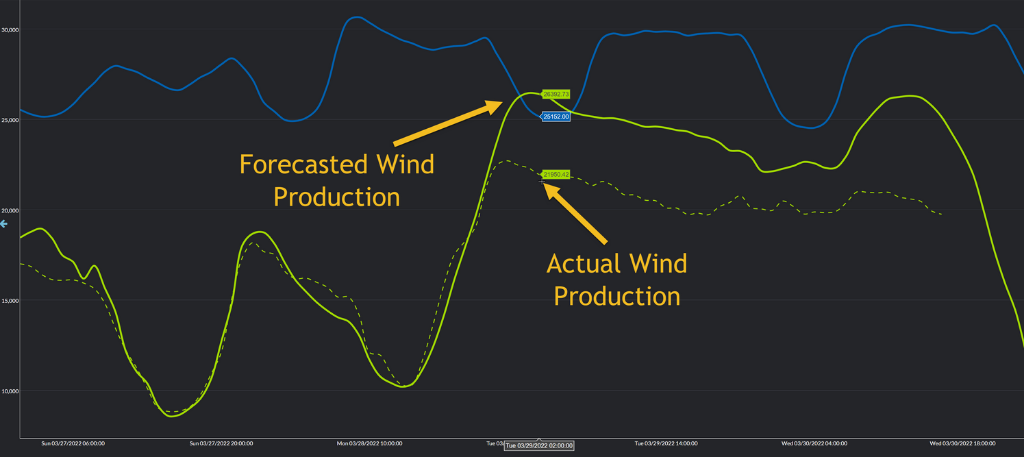
To solve this grid imbalance, the ISO must send signals to generation plants to curtail output. If all dispatchable generation has reached their defined minimum reliable output levels, the ISO will send escalating signals to reduce generation. This typically manifests as negative prices across the ISO until reaching a level where wind facilities reduce output (as low as -$35MWh after accounting for Production Tax Credits).
Looking at the next chart, we see the differences between the forecasted values and what the real-time output actually looked like for keeping a balanced and reliable set of grid conditions. The delta between wind generation capability and actual wind generation is considered a curtailment.
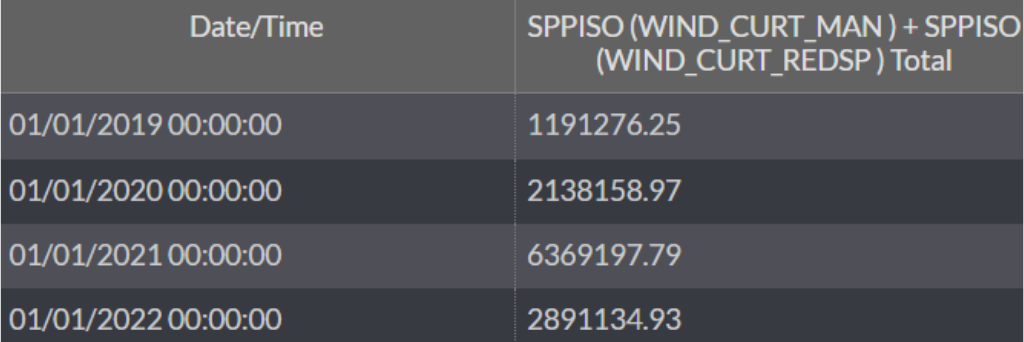
Taking a look at some high-level curtailment data, this is not a new phenomenon to SPP but is a growing market condition. The ISO has already accumulated an excess of wind generation this year alone that nearly triples the total curtailed MWs from 2019. In 2021, the ISO curtailed through manual and market redispatch 6.3 TWh of generation.
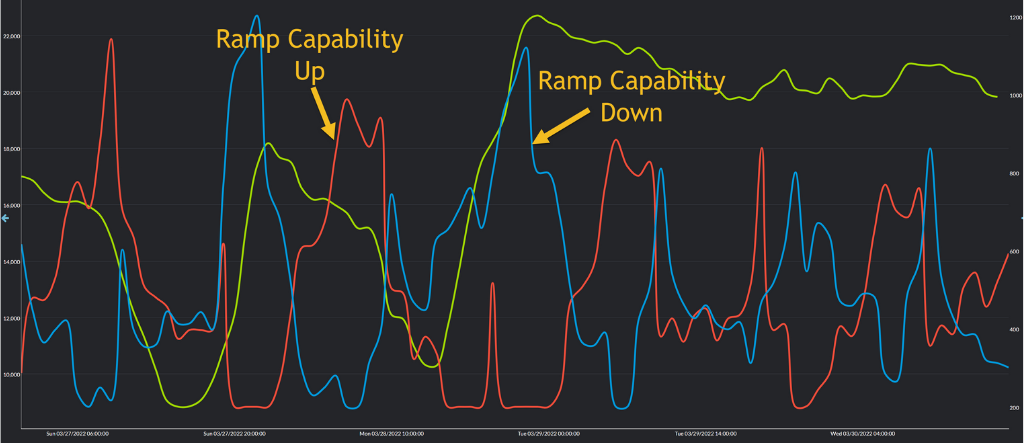
Along with new renewable penetration records, SPP has recently launched a new market product to assist with these changing market dynamics. When conditions occur that large percentages of generation are being served by non-dispatchable resources, being able to accommodate changes in that generation becomes a bigger challenge. Typically ISOs have dealt with uncertainty through Ancillary Service products such as ramp up, ramp down, spinning reserves, etc. Those ancillary resources could be activated instantly to account for system imbalance conditions. SPP’s new product called Ramp Capability (Revision Request RR-361) has been developed to assist in conditions that may be solved by holding additional ramping assets for more than the current five-minute model solution. If all ancillary products are used at the first imbalance of load or renewable generation forecast error, conditions such as scarcity pricing can be activated and result in a less stable and reliable grid. The following chart allows us to see the distribution of this new product alongside wind generation. As the changes in the wind production forecast grow, so does the acquisition of this new ramp capability product. This is both to account for increasing and decreasing wind generation (green).
Renewable assets across all ISOs are growing. As a result, the market dynamics are evolving as well. Grid conditions that were a thought experiment years ago are actually occurring now, and having the right data and tools to evolve with the markets will continue to be crucial.
To learn more about how Yes Energy’s data and solutions can support your strategy in an evolving market, sign up for a complimentary consultation or demo with one of our market experts.

For insights like this delivered straight to your inbox, subscribe to our blog!
 About the author: Jake Landis has been involved in nodal power markets since 2007. He previously worked at a large utility company in real-time trading and asset optimization through term and financial power products. Additionally, he spent time trading financial products with a private trading firm before joining Yes Energy in 2019.
