


Share this
by Daniel Cullen on Jul 07, 2025
Financial transmission rights (FTR), also referred to as transmission congestion contracts (TCC), congestion revenue rights (CRR) or transmission congestion rights (TCR), are hedging mechanisms in power markets that help electricity suppliers, utilities, and energy traders manage the financial risks associated with congestion costs. When used as a financial derivative product for anticipatory, proprietary, and speculative trading, FTRs can also enhance market efficiency and arbitrage opportunities.
This will explore the key pieces of competitive intelligence that you need to develop models to successfully maximize FTR trading opportunities.
The Importance of Competitive Intelligence
Competitive intelligence is a critical component of any FTR trading strategy. Understanding market trends, your competitors, and what they’re doing is key to improving your bid and risk management strategies.
In terms of macro-level market trends, you must consider three key datasets – the number of participants, trading volume, and cost – when determining which market offers the greatest opportunities.
Number of Participants
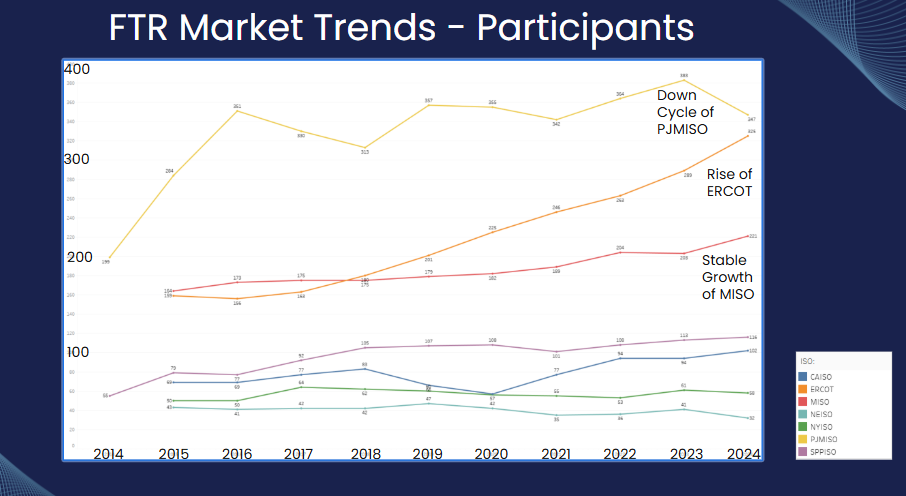
The number of active traders participating in an FTR market impacts competition, market efficiency, potential profit margins, and ultimately your FTR trading strategies. In highly competitive markets, margins can be lower, and it can be more difficult to secure FTRs at a discount. Conversely, markets with fewer traders bidding on key paths have more arbitrage opportunities, though they come with higher risks.
Analysis of participation data shows that the PJM Interconnection (PJM) has the greatest number of participants, though participation is trending down with more stringent credit/collateral requirements, underfunding concerns on actual payout levels, and increased conservatism in network modeling leading to reduced market opportunities with more outages, lower line limits, and additional constraints. Perhaps what's most striking in the chart below is the growth of the Electric Reliability Council of Texas (ERCOT) market. ERCOT will likely surpass PJM in terms of the total number of trading entities in 2025. The Midcontinent Independent System Operator (MISO) continues to have stable growth, while participation in the other Independent System Operators (ISOs) is largely static or in decline.
Overall Volume of FTR Trading
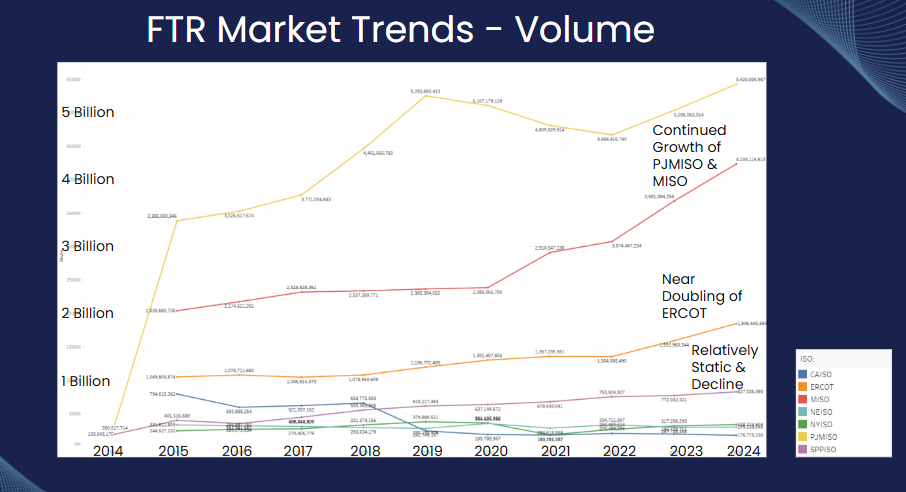
The overall volume of FTR trading, measured in megawatts (MW), is also critical because it impacts market stability and price discovery. The higher the trading volume, the more stable congestion prices are because they tend to reflect actual congestion trends rather than speculation.
As shown below, PJM had the highest volume with approximately 4.6 billion MW traded in 2024. MISO was second with around 4 billion MW. We also see that ERCOT trading volumes doubled in the past 10 years, while other ISOs have lower volumes and more stable growth.
Cost (Total Market Investment)
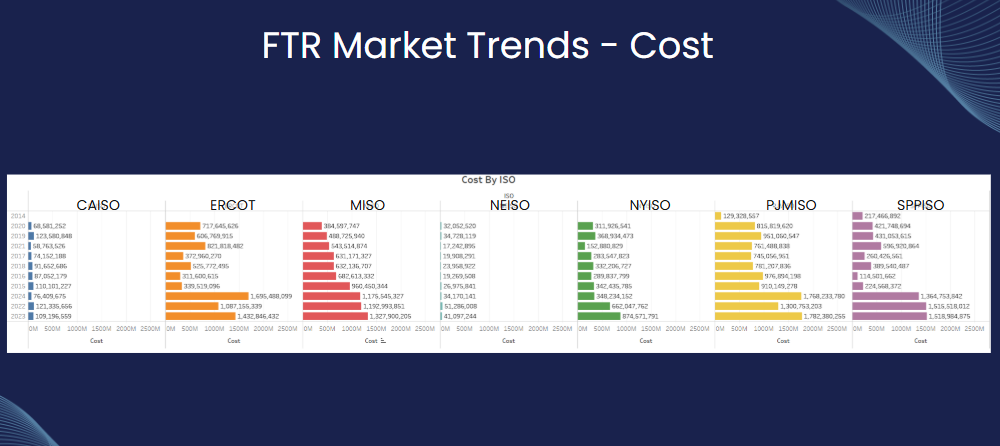
The third macro-level consideration when developing a successful FTR trading strategy is the total investment (or cost) within each ISO. The amount of capital invested in an FTR market indicates how much risk traders are willing to take.
Below, we see that PJM, the Southwest Power Pool (SPP), ERCOT, and MISO have the greatest total net dollar investments. In these markets, pricing is more efficient and returns are more stable. Profits, however, may be lower.
Markets with lower investment levels offer higher reward opportunities but also more risk.
Historical FTR Data
In addition to the big-picture market data for each ISO, participant-level awards and trade data are equally important when conducting competitive intelligence because they can predict future congestion patterns and pricing inefficiencies.
FTRs are sold via ISO-run auctions or through a secondary market. The auction data, including each trade made by each participant, the auction where it cleared, and the type of trade that's being held, is critical to providing full visibility into how each FTR market operates.
By analyzing competitor positions, you can identify paths where major entities are reducing holdings, signaling a potential decrease in congestion and lower future returns.
Conversely, increased holdings by key players may indicate confidence in a congestion hotspot, offering a signal to enter positions before prices increase.
Looking Forward to Grid Changes
Since the past is not a perfect predictor of the future, FTR market participant models must also understand how generation, load, and transmission network changes could impact grid congestion and prices.
For example, new transmission projects could alleviate congestion but lower FTR value in previously constrained zones. New large loads, such as a data center or large manufacturer, could create more congestion, increasing the value of FTRs on affected paths.
As a result, understanding what the grid of the future will look like is tremendously valuable. Understanding the who, what, where, and when of future infrastructure or load projects allows you to better forecast their impact on the grid.

Pulling It All Together for You
Yes Energy tracks the data you need to identify FTR market trends, efficiency, and future congestion.
Our FTR Positions Dataset tracks the number of participants, volume, and investments, helping you identify and take advantage of market shifts.
This dataset also gathers and harmonizes FTR auction data at the entity and parent levels, giving you a clear picture of how your competitors are performing trade by trade. The dataset includes more than 10 years of auction data from each ISO.
Layering in constraints in PowerSignals® further enriches the data, providing details like the total size and profit of holding a position. This illustrates how well a competitor is performing and how their positions have shifted over time.
Also located within PowerSignals®, our Infrastructure Insights solution significantly advances your ability to predict and understand the future grid. It allows you to explore generation, large load, and transmission projects that have been announced, are in development, or are under construction.
You can filter the easy-to-navigate platform based on the ISO region, activity type, and a project’s development stage. You can also visualize the results on an easily digestible map. Each project record includes publicly available data on the who, what, when, and where of each project as well as its forecasted impact on the grid.
Why Yes Energy’s FTR Trading Tool?
FTR trading success depends on understanding market competition, liquidity trends, and investment flows, while also anticipating future grid congestion shifts.
Our datasets provide the competitive intelligence you need to stay ahead. Backed by big data analytics and machine learning, our team of experts pulls together the competitive intelligence data you need so you can focus on your trading model, not data collection.
Highly flexible, the Yes Energy solution enables you to build your model by tapping into large datasets such as the FTR Positions Dataset. You can then leverage our geospatial and grid mapping tools and energy market simulation solutions to automate trading execution.
Contact Yes Energy to learn how our competitive intelligence tools empower you for success within the FTR markets.

About the author: Daniel Cullen has more than 10 years' experience in commodity and power markets. The majority of that experience focused on the development and delivery of performance and risk solutions. At Yes Energy, he serves as the product manager for Submission Services, Position Management, and FTR Positions Dataset.
