


Share this
Are you looking for data on financial transmission rights (FTRs)? FTR trade and forward price data is publicly available, and you can analyze it to identify recruiting targets and improve your trading strategies.
At Yes Energy we collect and manage this data to support FTR market competitive intelligence and analysis of market trends through our FTR Positions Dataset solution.
An Example of Analyzing FTR Market Trends
One of the ways customers use our FTR position, profit and loss (P&L), and mark-to-mark (MtM) data is to analyze price volatility in these illiquid markets.
A common way to use this dataset is to review how the value of an FTR changes between the last auction it was traded in and where it settles. The last auction is called the monthly auction – and these monthly auctions set the last marked value of the contracts going into the settlement period.
An important data point is understanding whether there are trends in the difference between that last marked value (Mark in the below chart) and where the contracts settle during the month (Revenue in the below chart). In the below chart we’re analyzing this data for ERCOT, MISO, PJM, and SPP (the four largest FTR markets):
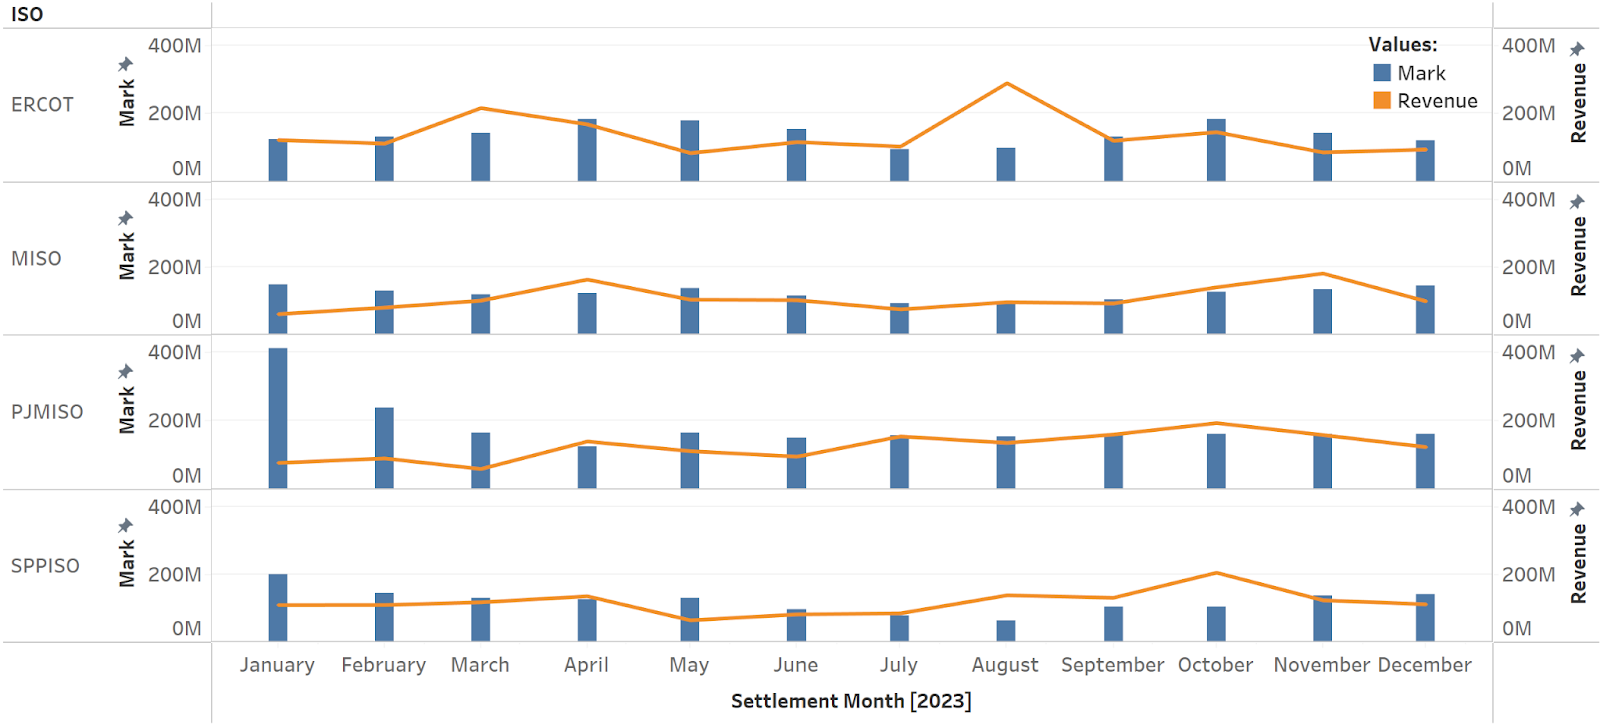
Source: Yes Energy’s FTR Positions Dataset
The blue bars in the chart are the values of the positions using the relevant monthly auction, and are tied to the left axis. For example, January is showing the value from the January 2023 monthly auction that was traded in December 2022.
The orange line is the final settlement value in the day-ahead market, and is tied to the right axis.
Looking at PJM for January 2024, you can see the marked value (blue bar) leading into the month far exceeded the actual settlement values (orange line). Conversely in the summer months, like August, the FTRs in all markets were generally undervalued in the monthly auctions.
The above chart analyzes market-wide trends, but you can do similar analysis on a more granular level (path, market participant, etc.) depending on the input needs for your FTR trading strategies.
Analyzing Data Improves FTR Trading Strategies
Look for the following data to better inform your FTR trading strategies and recruitment activities:
- How have the value of paths changed from one auction round to the next?
- Identify top trading opportunities quickly, so you can improve your bidding strategies.
- The below example is from ERCOT. We are analyzing the top 10 paths by viewing the changes in “auction over auction” values for March 2023 settling trades. The mark_change_pmv is the change “auction over auction” on a per MW basis. You can see to compile this, it took 4.1s to run this for the entire ERCOT market.
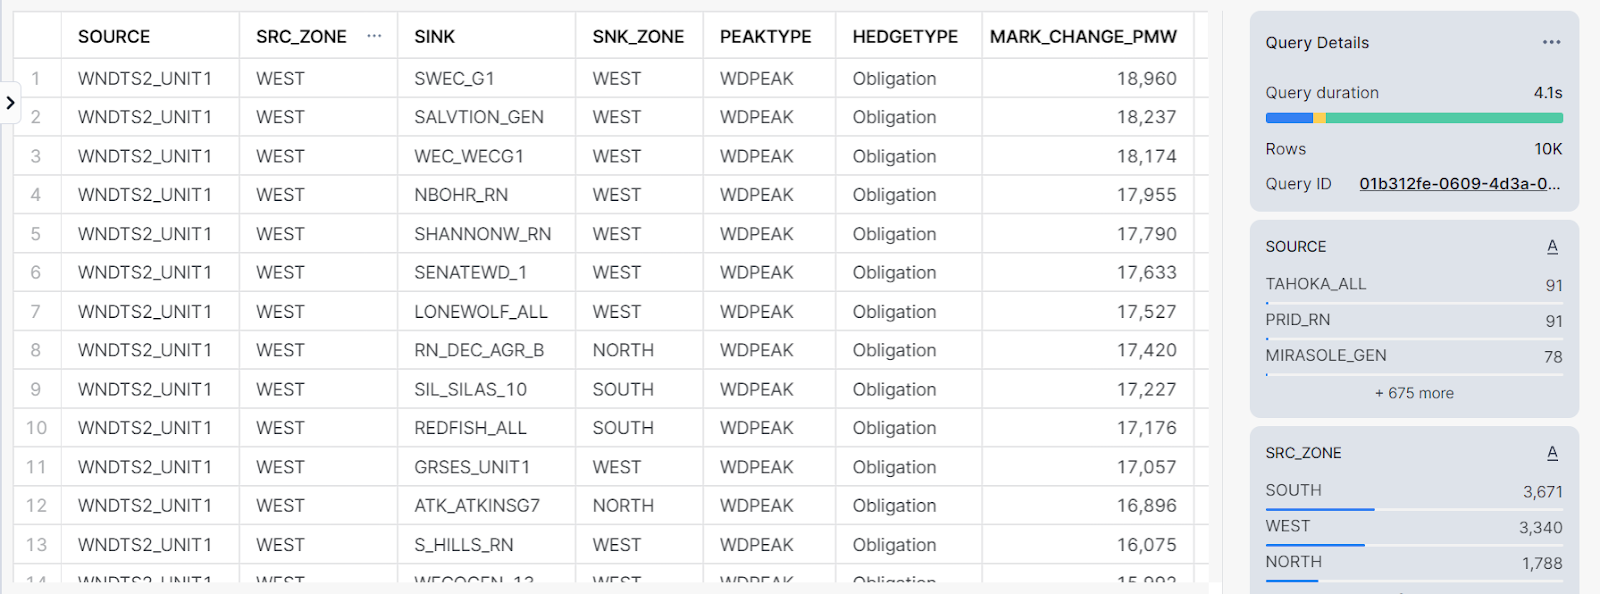
Source: Yes Energy’s FTR Positions Dataset
- How are my competitors performing?
- This allows you to see the outcome of competitors’ trading strategies and whether you’ve missed opportunities in the FTR market that your competitors have captured.
- Below is an example of analyzing who the top players are in a specific ISO by mark-to-market (MtM) values:
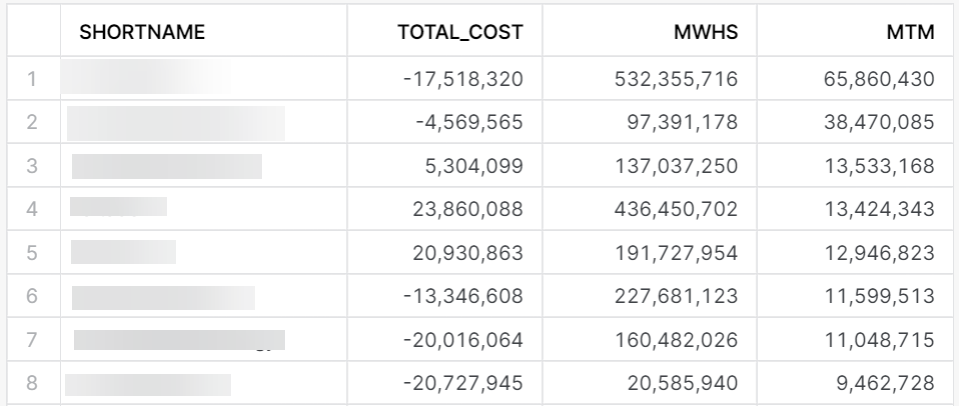
Source: Yes Energy’s FTR Positions Dataset
- How is trade volume changing across the markets and competitors?
- Seeing how FTR trade volume is changing in the markets enables you to see where market peers are investing in FTR positions and whether any patterns should inform your decisions.
- Below is an example that shows the volume over time of top industry players in PJM, and comparing those values to Greenhat’s volume over time:
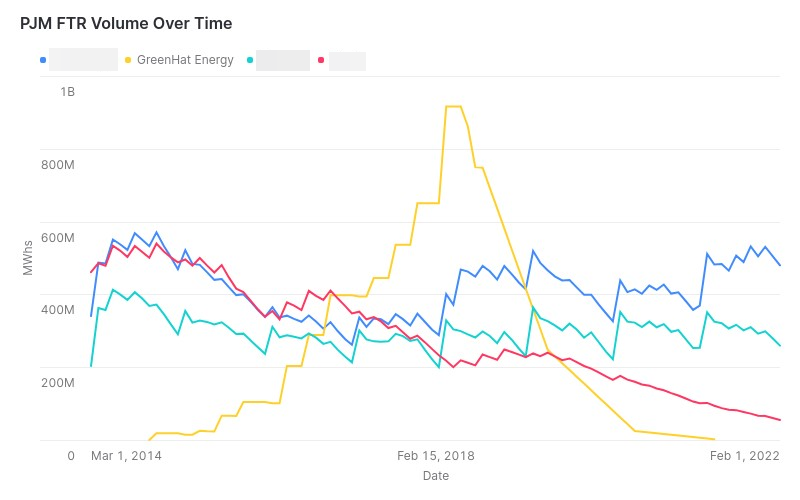
Source: Yes Energy’s FTR Positions Dataset
- Which companies have the top FTR traders?
- Knowing which FTR traders are performing best can highlight which traders are the top targets in the industry.
- This is valuable for current employers to focus on retention as well as competitors that wish to recruit them.
Answering these questions, and more, can help to identify recruiting targets and improve performance of your FTR trading strategies.
Yes Energy Can Help with FTR Trading
Yes Energy’s FTR Positions Dataset solution provides FTR trading organizations and regulators with unprecedented visibility into FTR market positions. Historically, only FTR trading organizations with large IT budgets have been able to build systems to gain visibility into the positions, performance, and risk of their competitors in the market. With FTR Positions Dataset, you can outsource this expensive data management, including trade capture, model remappings, and ISO changes.
The following capabilities are available in FTR Positions Dataset:
- Coverage of all positions in US FTR markets
- Industry-standard methodology for marking and settling FTR positions, providing contract level closed (realized) and open (MtM) P&L data
- Standardized risk metrics available to compare risk usage across markets and participants
We deliver all of this on the powerful Snowflake cloud platform. (Snowflake is a data warehouse available across multiple cloud regions). This allows you to answer the above questions in seconds, compared to a more manual process that may take hours or even days for each auction. You can also further integrate this data with Yes Energy’s DataSignalsTM Cloud datasets, internal data, and other third-party data available on Snowflake, fueling powerful big data analysis.
Learn more about the FTR Positions Dataset today, or 
.jpg?width=103&height=137&name=Stephanie%20Staska%20(1).jpg) About the Author: Stephanie Staska is the director of trade and risk products at Yes Energy. She has worked in energy risk management and compliance for the past 20 years, including time at Twin Cities Power, Cargill, and Split Rock Energy. Stephanie received her MBA and her bachelor's degree in actuarial science and mathematics from the Carlson School of Management at the University of Minnesota. She enjoys traveling and spending time with her family.
About the Author: Stephanie Staska is the director of trade and risk products at Yes Energy. She has worked in energy risk management and compliance for the past 20 years, including time at Twin Cities Power, Cargill, and Split Rock Energy. Stephanie received her MBA and her bachelor's degree in actuarial science and mathematics from the Carlson School of Management at the University of Minnesota. She enjoys traveling and spending time with her family.
