


Share this
by Ben Perry
There are plenty of electric load forecasts out there, but which is best for your needs?
Let’s compare two common electric load forecasting methods, a regression model and an artificial intelligence/machine learning (AI/ML) model, to see whether one or the other (or both) could deliver more value to your business.
Why Does Your Electric Load Forecasting Method Matter?
Accurately forecasting electricity demand in the near term helps utilities and power traders make decisions to operate the power grid more efficiently.
Even small improvements in electricity load forecasting accuracy can lead to large differences when scaled to a large utility, power trading organization, Independent System Operator (ISO), or Regional Transmission Organization (RTO).
The Basics of Power Demand Forecasting
Weather and calendar phenomena greatly affect power demand, and these effects follow regular patterns. Generally, power consumption spikes in the summer and in the winter when heating and cooling systems are most stressed.
For example, in the chart below you can see peaks in power demand from January 1 through March 15, June 15 to September 15, and again November 15 to December 31, 2023.

Source: Yes Energy’s electricity load forecasting software (formerly TESLA)
Power demand is so sensitive to temperature that consumption can be 50% higher on peak temperature days compared to seasonally average temperatures, as we see in the chart below.
Other weather parameters impact power consumption to a lesser extent including humidity, wind speed, cloud cover, solar irradiance, and precipitation.

Source: Yes Energy’s electricity load forecasting software (formerly TESLA)
In addition to responding to the weather, consumers behave differently during various times of the day, days of the week, and holidays. In the chart below, you can see electricity demand fluctuating throughout the day, during the week, during the weekend, and during Memorial Day.
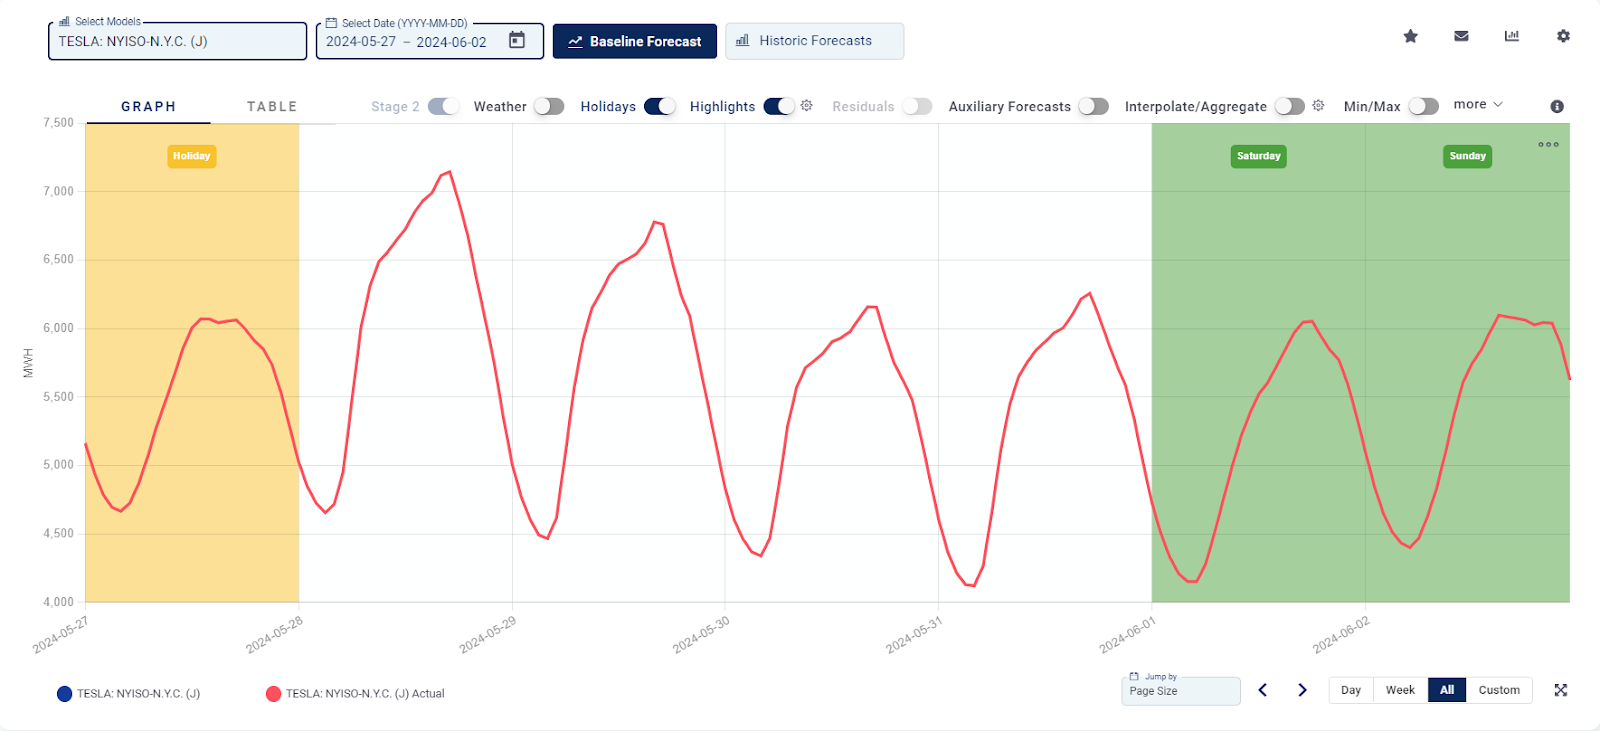
Source: Yes Energy’s electricity load forecasting software (formerly TESLA)
What Makes an Electricity Load Forecasting Software Valuable?
To get the most value from your power demand forecast, you should understand some key factors. Ideally, your electricity demand forecast or forecasts should:
- Have a low margin of error on the days with the highest prices, which can greatly impact your bottom line.
- Avoid big misses on all days.
- Behave consistently so you can use it to predict events accurately.
- Have a different perspective from the consensus. This allows your electricity demand forecast to highlight opportunities other forecasts might have overlooked.
A Comparison of Electric Load Forecasting Methods: Regression vs. Artificial Intelligence
A regression model: An example of a regression model is Yes Energy’s power demand forecasts.
The solution is an advanced regression model that uses detailed demand and weather observation history and incorporates the latest near-term data to respond to changing weather patterns, extreme weather events, and holidays that might impact energy demand.
The model itself operates in two stages: a highly parameterized nonlinear regression model and a time series filter for forecast adjustment based on recent experience.
The basic philosophy of the model is that load varies based on a large number of more or less independent decisions that a large number of people make.
Consequently, to capture as much of the variation in load as possible, Yes Energy’s model takes an information-intensive approach to the problem.
To handle many variables over many observations, the model employs a first stage that's a nonlinear regression model estimated by a least-squares procedure. Subsequent stages incorporate an autoregressive moving-average model (ARMA)-type post-processor for correcting forecasts based on recent errors.

An artificial intelligence model: A branch of artificial intelligence (AI), machine learning (ML) uses algorithms to learn from past experience. Machine learning can handle complex and nonlinear problems that are challenging to solve with other methods. It’s useful for locating patterns and for optimizing processes.
Like a regression model, an AI model employs data to make predictions. While a regression model generally assumes data follows a certain pattern, such as normal or binomial, AI can handle any type of data.
What Is the Same Between Regression and AI/ML Models?
- Both require acquiring and cleaning input data.
- Both need variable definitions before model training.
- Both depend on accurate and unbiased weather forecasts.
- Finally, both require regular monitoring by humans to achieve the best results.
What Are the Differences Between Each Method?
A Regression Model
- A regression model requires a team of analysts to evaluate the forecast’s “sanity” on a regular basis. This results in more scrutiny over the forecasts to catch anomalies.
- A regression model offers greater visibility into what impacts forecasts on specific dates. It is easier for users to find clear explanations as to why a forecast generated by the model looks the way it does.
- It allows for analysts’ discretion for including or excluding variables with few samples, e.g. holidays or times with extreme weather.
An Artificial Intelligence/Machine Learning Model
- The AI/ML model requires less analyst time to change model configuration. This results in more frequent model changes, and it’s less costly to maintain in times of typical weather and times without holidays.
- It also requires less set-up time, so there are fewer costs associated with setting up AI/ML models.
Feedback from Customers about Our Regression Model
When talking to our customers, we’ve learned that Yes Energy Demand Forecasts are more accurate and perform better:
- When weather patterns change significantly
- During periods of extreme heat or cold
- During holidays and days around holidays
This is partly because our team of experts scrutinizes our forecasts. That explanation is also key to our customer service – if you want to know why a forecast exhibits a certain shape or is at a certain level, you can call or email us and we’ll communicate directly with you to explain the underlying reasons.

An Example of Forecast Accuracy: Juneteenth
In 2024, Juneteenth presented a unique challenge with only three years of history and continued changes in how many companies observe it. (It’s only been a federally observed holiday since 2021.)
Despite these challenges, Yes Energy load forecasts came through. The day-ahead peak load forecast (7:30 a.m. on June 18) was within 415 MW (0.3%) of the actual load, better than the ISO forecast peak which was off by 2,700 MW (1.8%).
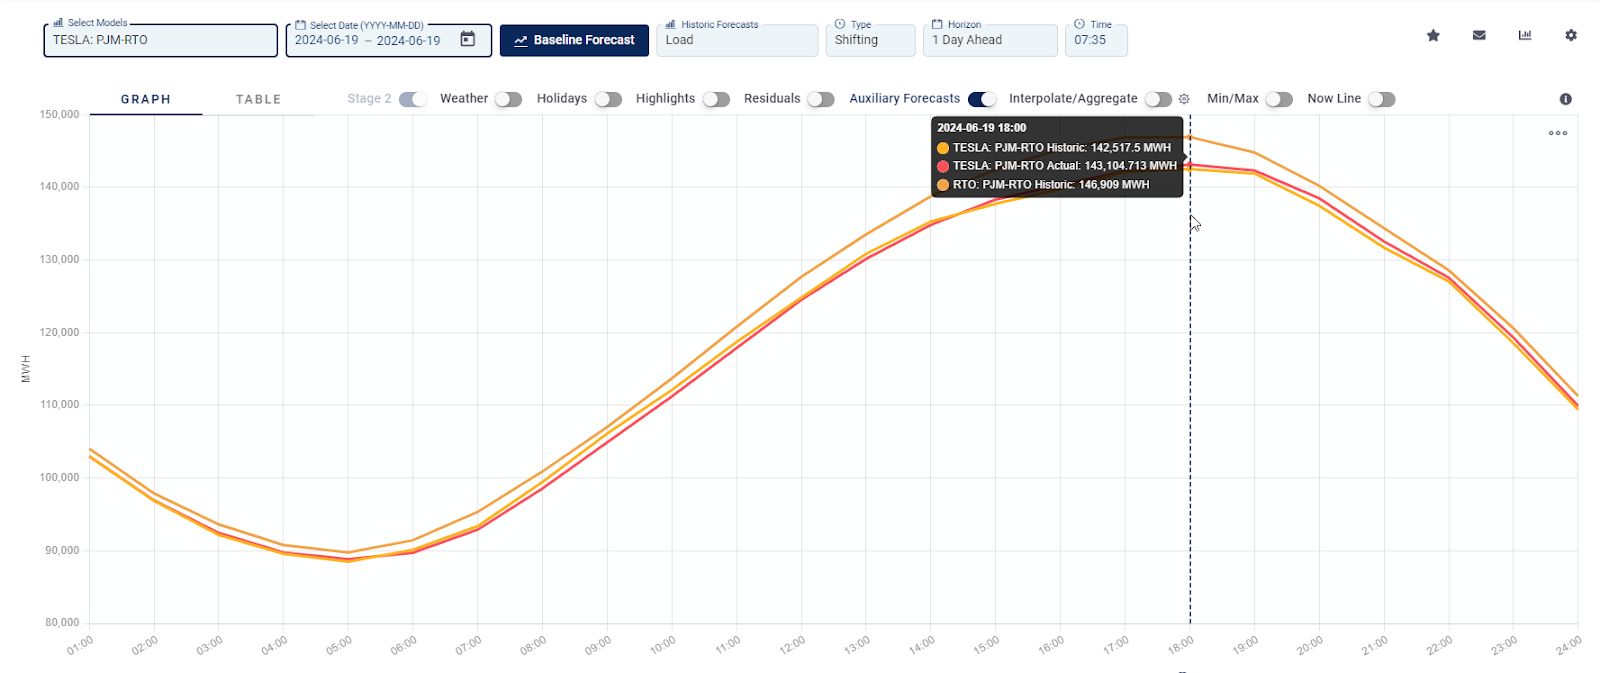
Source: Yes Energy’s electricity load forecasting software (formerly TESLA)
Peak demand on Juneteenth, 2024, occurred during the hour-ending interval 18 EDT.
|
Load (MW) |
PJM Total DA LMP ($) |
PJM Total RT LMP ($) |
DART ($) |
|
142,400 |
$67.64 |
$176.71 |
-$109.07 |
We dove into another example of the accuracy of Yes Energy's Demand Forecasts during a holiday that coincided with a heat wave in CAISO.
Conclusion
So, you want to know which demand forecast is best for your business? The answer is – it depends.
While we have a team of experts standing behind our demand forecasts, they might serve you best in conjunction with an AI/ML model.
Let’s recap their advantages:
- Visibility
- A regression model is more of a “glass box” than an AI/ML model.
- Analysts can give customers better insight into why forecasts look the way they do.
- Efficacy
- Regression forecasts perform better at times when an accurate forecast is most valuable, like days with extreme temperatures.
However, many of our clients have found that our forecasts do best when they complement an AI/ML power demand forecast model. That’s because regression forecasts perform better at different times than AI/ML forecasts.
Our forecasts shine on days with “abnormal” demand, like when PJM issued a Hot Weather Alert, and AI/ML models generally perform well on days with “normal” demand.
Ready to see the Yes Energy difference for yourself? Ask our team a question or request a demo.

About the author: Ben Perry is the senior product manager of forecasting at Yes Energy. Ben brings 10 years of experience as a power demand forecast analyst to the Yes Energy product team. He's now focused on applying that experience to steering the Yes Energy forecasting product roadmap to best serve the industry through the energy transition.
