


Share this
Load forecasts are most challenging and important during periods with limited historical analogs, such as during holidays, extreme weather conditions, or a combination of both. Yes Energy’s Demand Forecasts (formerly TESLA) excel on those days.
Our previous post gave a preview of an upcoming heatwave in CAISO, so how did our California energy demand forecast and the California Independent System Operator (CAISO) perform July 4 to 12?
Let’s compare.
For this analysis, we’ll use the version of the load forecasts published by CAISO and Yes Energy just before the day-ahead market closing at 10 a.m. Pacific Time the day before the forecast was valid. That cutoff time is relevant for market participants looking to make decisions about whether or not to participate in the day-ahead market. Also, the standardization across forecasts lets us evaluate accuracy on an apples-to-apples basis.
Heat Wave Hits CAISO During a Holiday Week
CAISO's most recent heat wave ramped up on July 4, 2024. Forecasting the load for that day posed even more challenges than other high-temperature days because power demand is particularly unpredictable on major US holidays when businesses are typically closed.
To help improve accuracy on days like this, Yes Energy's energy demand forecast model looks at the last 11 years of weather and load data, which mathematically ensures that we have at least one instance of every holiday falling on the same day of the week as it is in the current year (Thursday in the case of July 4, 2024).
Looking at both the peak hour load forecast and the overall daily load forecast, Yes Energy Demand Forecasts accuracy stands out compared to the ISO. Our load forecast during the peak load hour had an error of just 560 megawatts (MW) on a forecast of 37,948 MW, while CAISO’s forecast was 3,211 MW higher than actual peak load.
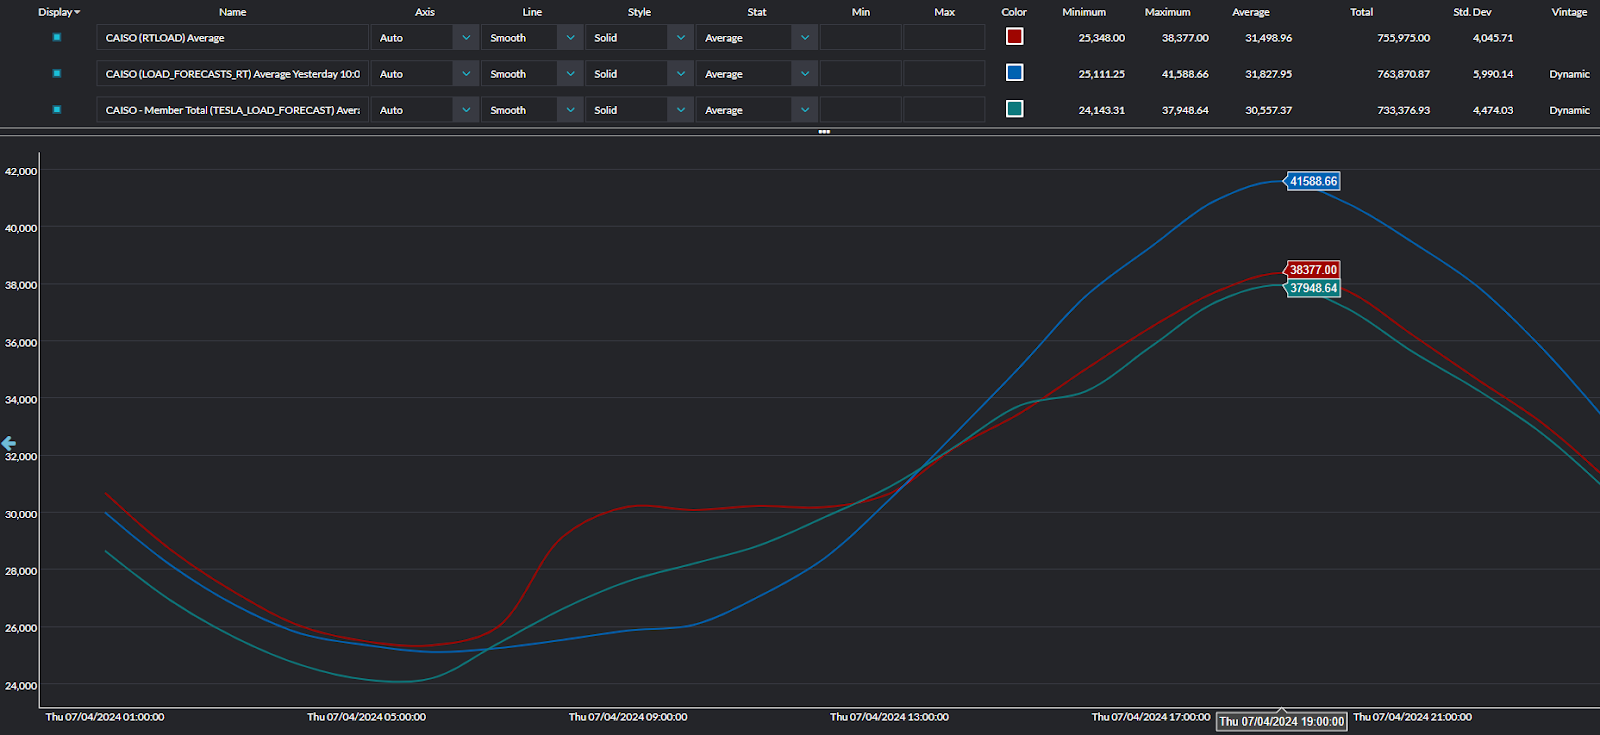
Source: Yes Energy’s PowerSignals
For more comprehensive comparisons, two widely used statistics are the mean absolute percentage error (MAPE), which measures accuracy as a percent of the overall forecast in each hour, and the root mean square error (RMSE), which penalizes large inaccuracies more heavily than small misses.
For the entire day, Yes Energy Demand Forecasts MAPE was 40% lower than the ISO's, and the RMSE was 45% lower, indicating better performance across the board.
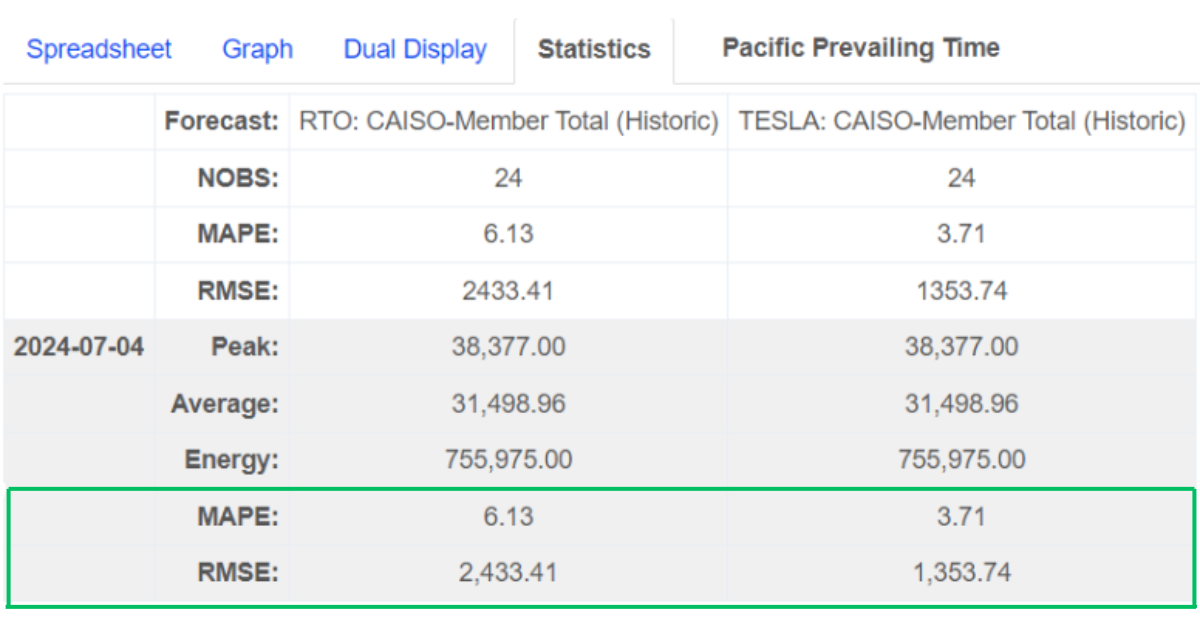
Source: Yes Energy’s California energy demand forecasts (NOBS stands for number of observations; in this case, 24 hours are in the forecast period because it’s one day.)
California Energy Demand Forecast Faces the Heat
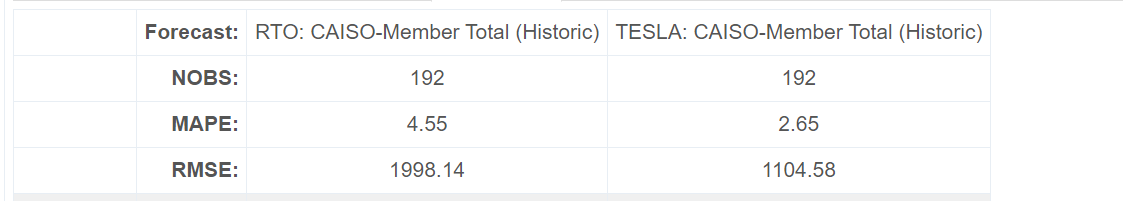
The heat wave wasn't over after July 4, though, as we saw an extended period of high temperatures continue for another week.
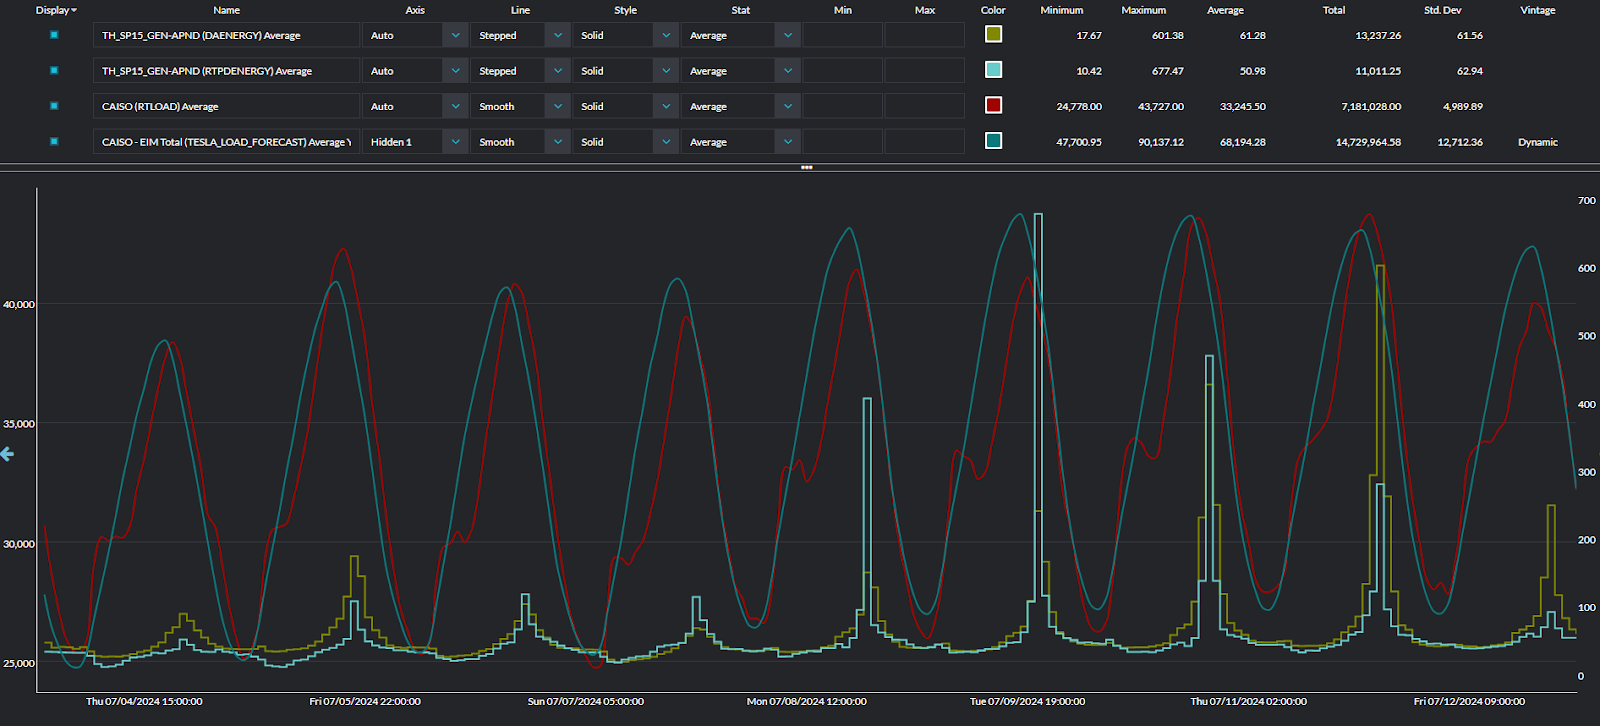
Between July 4 and July 12, Yes Energy's load forecasts were within 1,100 MW of actual daily peak load every day. CAISO's load forecast, on the other hand, had four days with a miss of at least 1,600 MW in the peak load hour of the day.
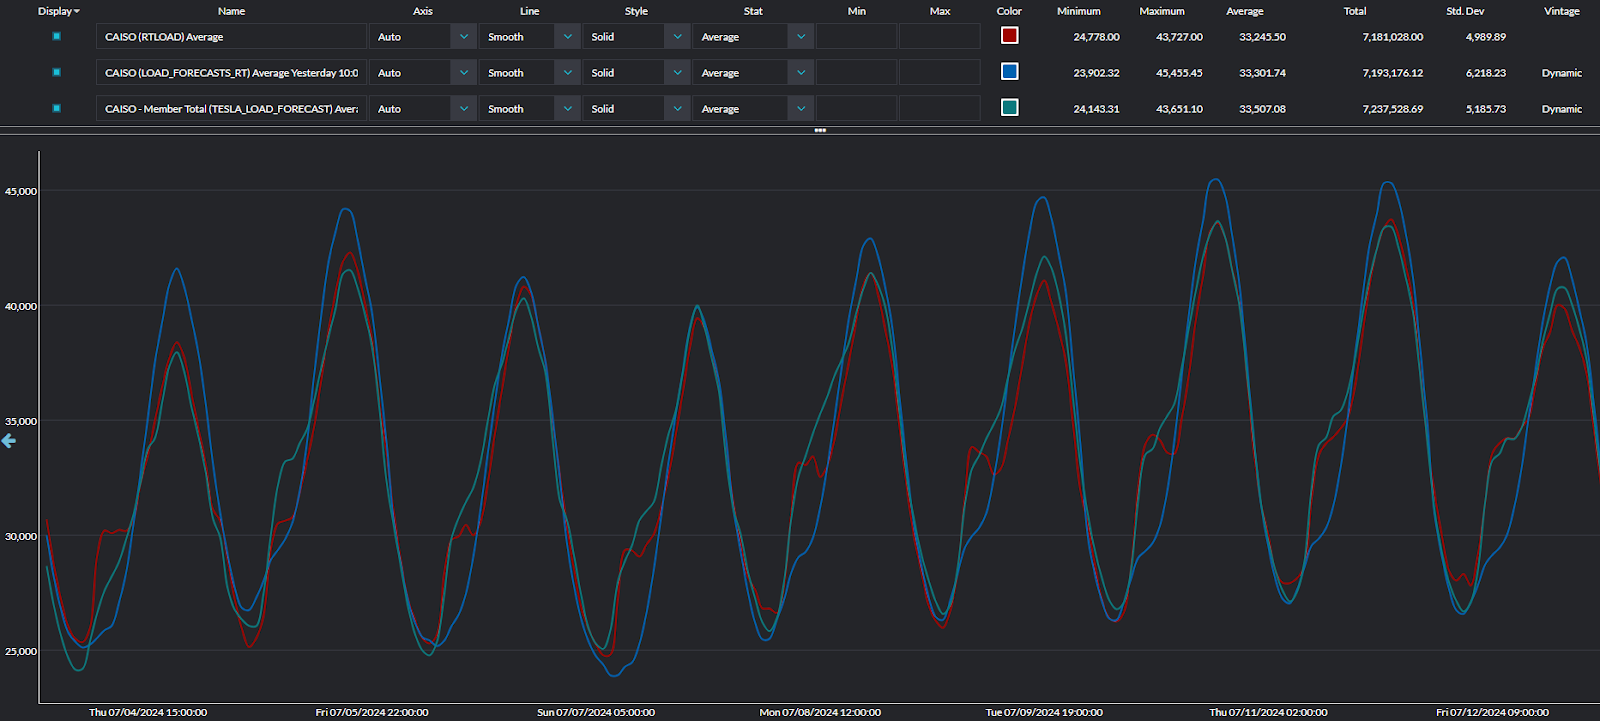
Source: Yes Energy’s PowerSignals. The Yes Energy load forecast is in green, the CAISO load forecast is in blue, and the actual load is in red.
Looking at a comparison across all hours of the day, our energy demand forecast had a 41% lower MAPE than CAISO's forecast – 2.65% vs 4.55%.
Not Just a CAISO Market Event
As covered in our previous CAISO post, the CAISO market is uniquely dependent on importing and exporting electricity from neighboring states – especially when temperatures soar. Of course, other states have to serve their own power consumers too, which means that the amount of electricity available for export to CAISO depends on how hot it is across the entire western region.
As a result, it’s important to understand demand across the Western Energy Imbalance Market (WEIM) accurately even if you are only active in CAISO. That’s why, in addition to our CAISO-only forecast, we also provide a forecast of the entire WEIM footprint plus each individual balancing authority (BA) in it.
From July 4 to 12, Yes Energy's WEIM load forecast had a MAPE of just 1.45%, giving you a clearer picture of how much CAISO could rely on regional electricity imports.
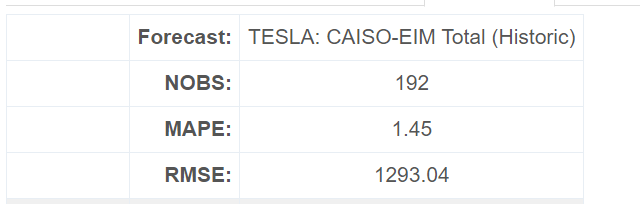
Source: Yes Energy’s demand forecasting
Our previous CAISO post also mentioned that similar regional heat waves in the past have been associated with energy price spikes in CAISO. Sure enough, we saw day-ahead or real-time energy prices reach $400 or more on four days with six days hitting at least $150 in one or more hours. The highest real-time hourly energy price during this period was $677.47 in Hour Ending 20 (8 p.m.) on July 9.
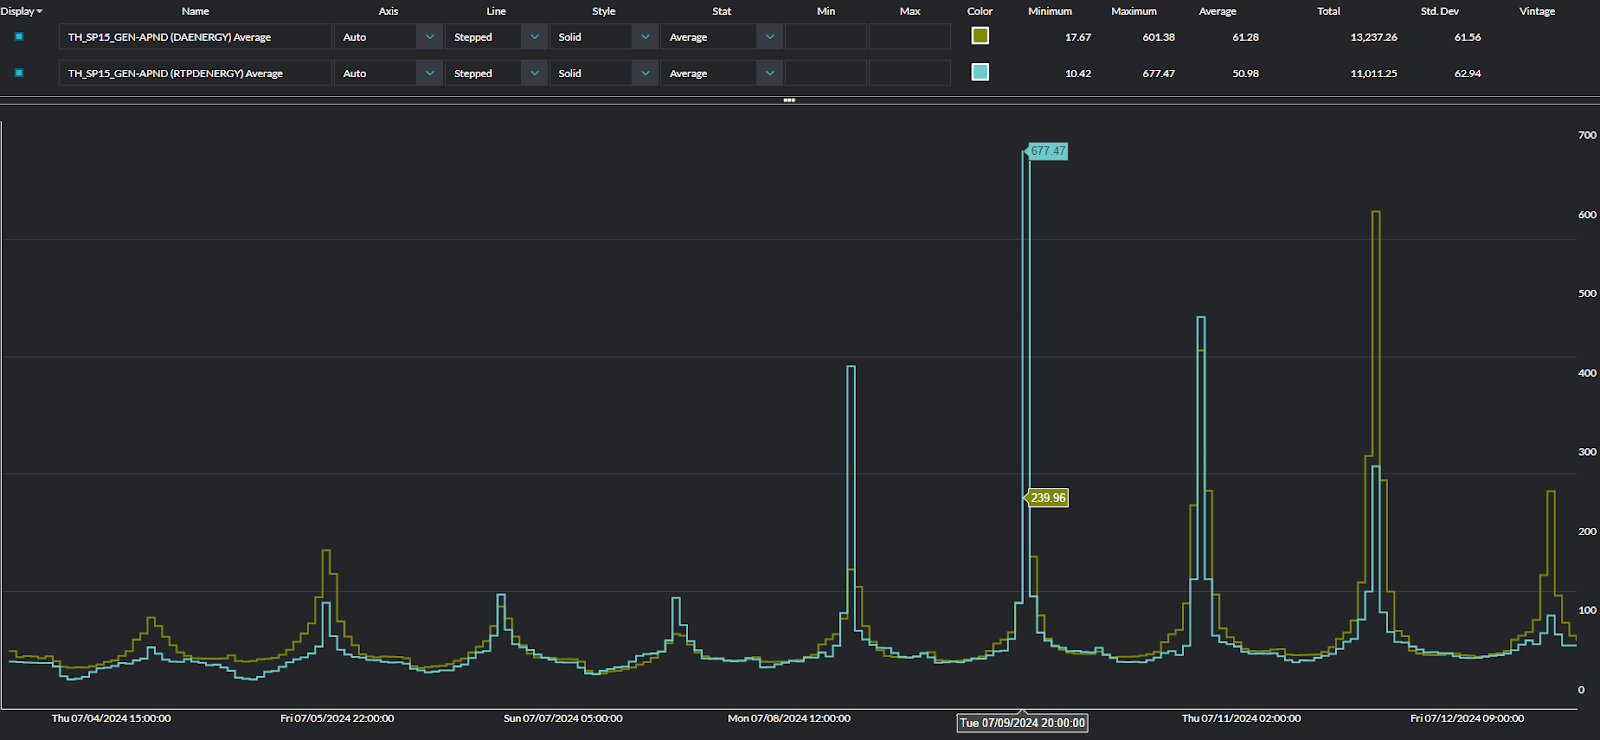
Source: Yes Energy’s PowerSignals
To put that in context, this was the first time in summer 2024 when real-time or day-ahead energy prices went above even $115. A trader with a superior load forecast would have had an opportunity to make more profitable trades in just a handful of hours last week than in the preceding three months combined.
Source: Yes Energy’s PowerSignals
One other observation that highlights the value of Yes Energy's WEIM load forecast beyond just our CAISO load forecast is that the largest magnitude real-time energy price spikes came on the day with the highest WEIM load (July 9) rather than the day with the highest CAISO-only load (July 11) which actually saw a day-ahead price bias.
Source: Yes Energy’s PowerSignals
Yes Energy's Live Power visualization tools capture why. On July 11 there were significantly more imports available via the MALIN and NOB interties because of lower demand outside of California compared to July 9.
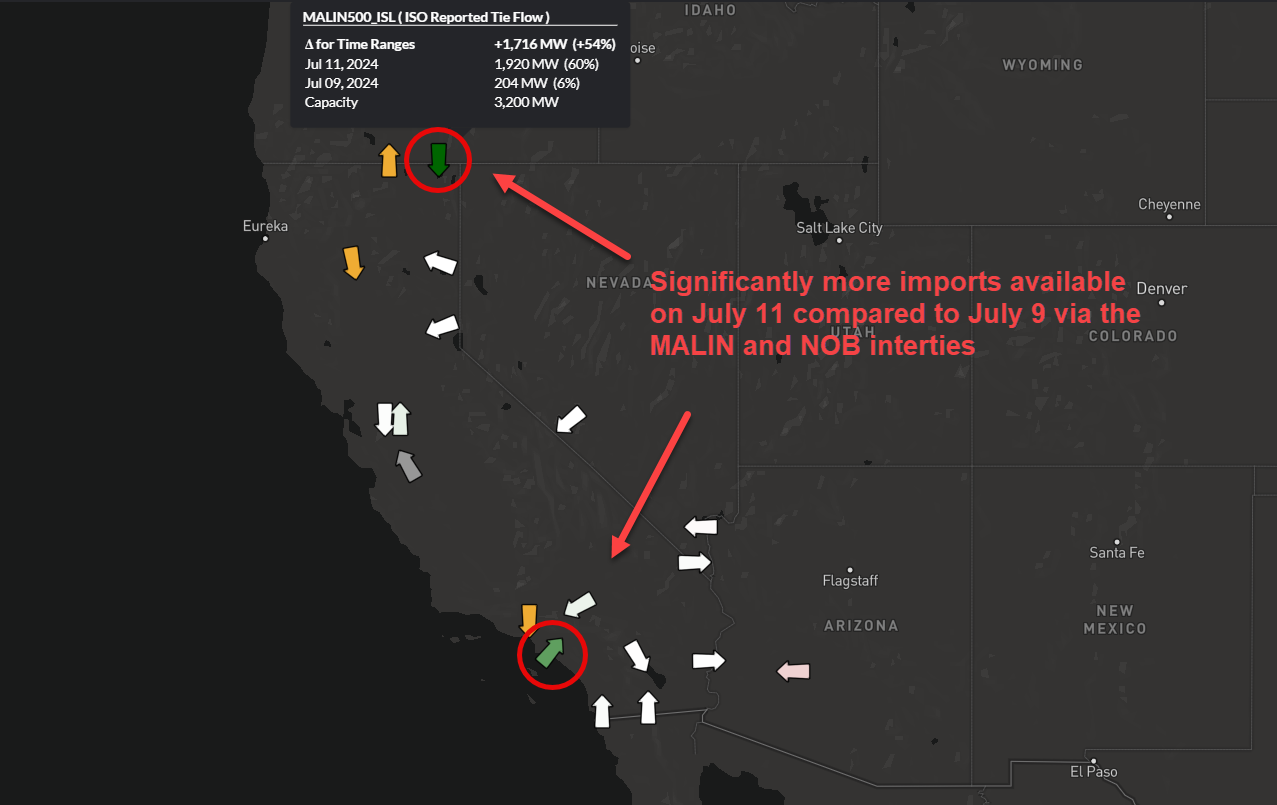
Source: The data is from the ISO, but the visualization is a part of Live Power.
Conclusion
As this analysis shows, if you had our demand forecasts for both CAISO and the WEIM, you had an edge during the most volatile price fluctuations of the summer so far – both in terms of accuracy and a single unified western forecast. Whether you are using Yes Energy Demand Forecasts as an input to a pricing model, in your fundamental analysis, or to calculate the best way to dispatch your generation, our high-quality forecasts can help you trade with confidence.
Generated with proprietary forecasting engines, our energy demand forecasting solutions feed comprehensive weather variables and calendar information to proprietary algorithms. The advanced regression model uses detailed demand and weather observation history and incorporates the latest near-term data to respond to changing weather patterns, extreme weather events, and holidays that might impact energy demand.
An expert team of analysts and engineers reviewing and maintaining every model, ensuring the most accurate and reliable forecasting in the industry.
To learn more about these energy demand forecasts, ask our team a question.

About the Author: Isaac Lichlyter was a former day-ahead power trader for eight years in CAISO, ERCOT, and PJM. While trading, he used Yes Energy tools, including Yes Energy's load forecasts, to diagnose the drivers behind price movement in the market, and now he is helping clients understand how our solutions can meet your needs.
