


Share this
by Alex Bennitt
What has historically been a coal-dominated fall outage season is starting to see combined-cycle gas turbine (CCGT) technologies take a larger share of offline capacity, affecting the fall generation mix and as a result heat rates.
Changes to summer generation dynamics, notably that coal generation is dropping in the summer in favor of cheaper natural gas generation, seem to have had downstream effects on the fall “shoulder” season when facilities normally perform maintenance between higher load summer and winter seasons. Changes to the fall outage technology mix have directly impacted generation trends and as a result have sent heat rates to higher levels as gas steam and gas turbine resources are seeing increased dispatch.
This phenomenon was observed in Live Power data across ERCOT, PJM, MISO, and SPP, covering 265.1 GW of coal and gas generation. Fall coal and CCGT generation dropping in favor of gas steam and gas turbine technologies is likely the result of increased CCGT offline capacity levels, which saw higher utilization this summer according to Live Power data. Coal offline capacity is a mixed bag across ISOs. In general the decrease in fall coal generation could signal a continuation of changing dispatch costs that are making the resource less competitive.
Figure 1: Live Power Summer Capacity Factor Changes (left) July to August, October season capacity factor changes (right), %
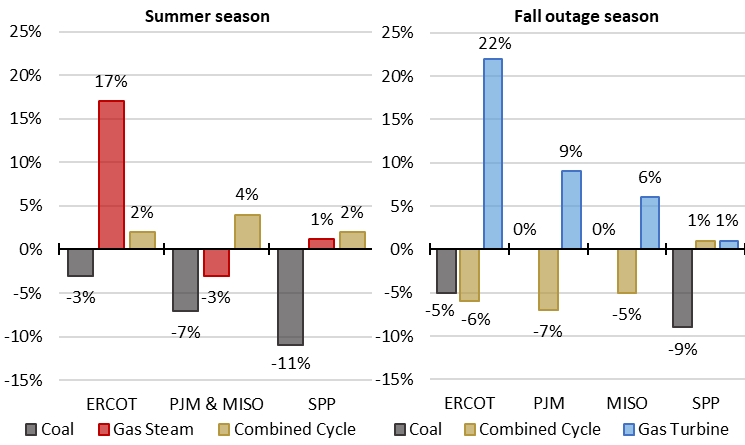
Live Power data provides insight into offline capacity by aggregating plant-level data into technology types. For plants that remained offline for a whole day, we added their capacity into their respective technology type for that day and then averaged it for the month. We then compared this to offline capacity numbers from last year to determine year-over-year (YOY) offline capacity changes.
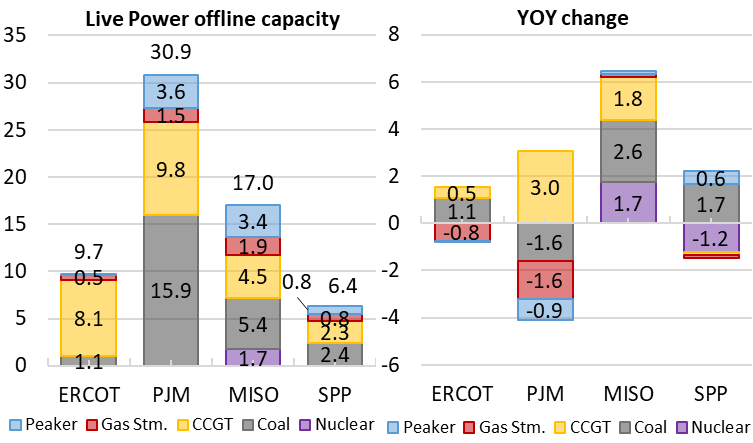
In ERCOT, coal and CCGTs had increased offline capacity, up 1.1 and 0.5 GW respectively, while 0.8 GW of gas steam units stayed online compared to last year. PJM saw 3.0 GW of CCGT offline capacity increases and 1.6 GW of coal offline capacity decreases.
MISO is the only ISO to see increases in offline capacity across all the thermal dispatchable technology types, with coal increasing the most, up 2.6 GW YOY.
In SPP, 1.2 GW of nuclear offline capacity decreases may have contributed to coal offline capacity increasing 1.7 GW.
Figure 2: 2023 Fall Live Power monthly average offline capacity by technology (left) and YOY change (right) for four ISOs, GW
The rest of the analysis will break down Live Power 60-second data specific to each ISO and look into thermal dispatchable technology offline capacity changes and generation changes in the fall. A brief summary of each ISO is listed below.
ERCOT
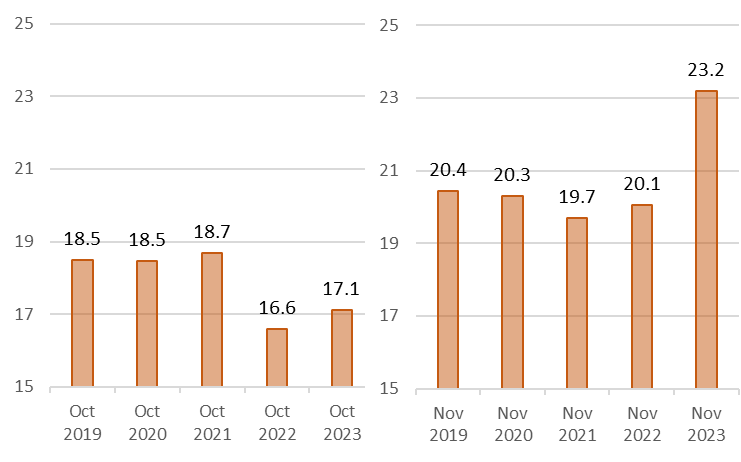
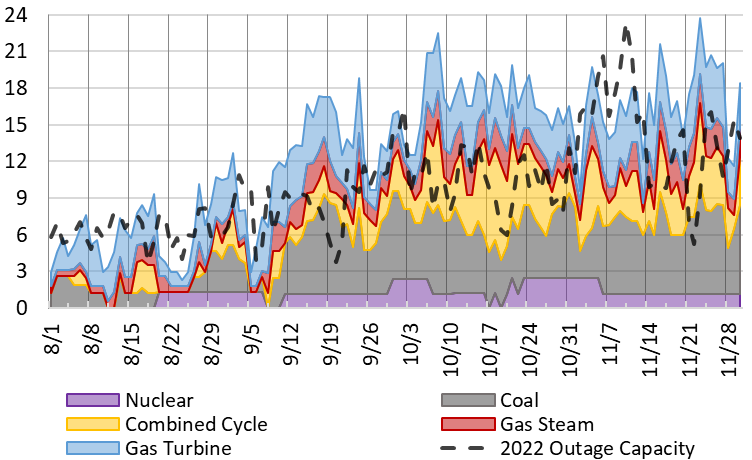
In ERCOT, intense load growth has shifted offline capacity to November, shortening the timeline for ERCOT’s thermal fleet to perform maintenance before winter operating conditions start. Offline capacity has also increased, as the aging thermal fleet got pushed to physical limits this summer when the ISO operated above 2022’s all-time load record for more than 200 hours.
Figure 3: Daily ERCOT resource outage capacity, October to November, last 5 years, GW
PJM
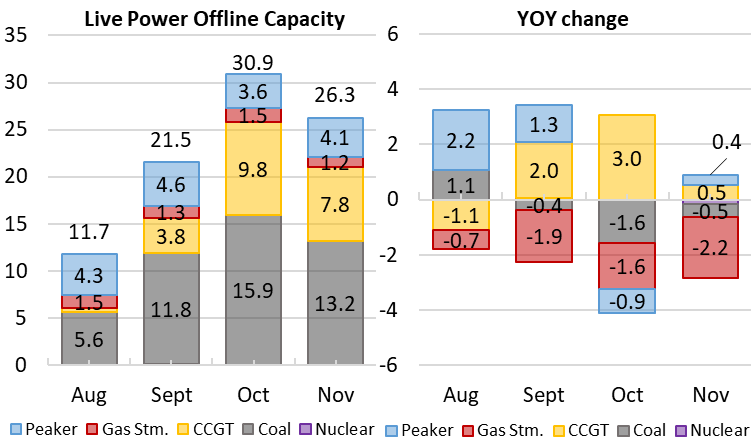
For PJM, coal-to-gas switching this summer was mirrored in fall offline capacity, where CCGT generators are seeing increased offline capacity levels and coal is seeing decreased offline capacity levels. This resulted in CCGT capacity factors down seven points (pts.) this fall, while coal generation didn’t change. The generation has been replaced with higher heat rate natural gas resources that pushed October heat rates to five-year highs.
Figure 4: 2023 August to November Live Power PJM monthly average offline capacity by technology (left) and YOY change (right), GW
MISO
In MISO, thermal dispatchable offline capacity has increased across all technologies. Coal generation has remained flat YOY with increased offline capacity, likely due to dispatch economics. CCGT generation has decreased five points YOY, and increased nuclear outages required dispatching gas steam and gas turbine technologies that sent heat rates to five-year highs.
Figure 5: 2023 Live Power monitored MISO daily average offline capacity by technology, June to November 2023, GW
SPP
For SPP, offline capacity dynamics haven’t changed in a big way; however, a nuclear fleet that was not on outage this fall displaced mostly coal generation. Coal generation, down nine points, was also driven down by large decreases in net load levels. SPP coal dropped from 46% utilization to 37%, which still leaves the technology as the largest thermal provider of generation in the ISO, but changes in dispatch costs likely placed more expensive coal facilities on the chopping block.
Table 1: YOY comparison of capacity factors for Live Power monitored thermal dispatchable technologies in SPP
Resource Type
|
Live Power capacity, MW |
October 2022 |
October 2023 |
YOY 𝝙 |
|
|---|---|---|---|---|
|
Nuclear |
2,141 |
12% |
79% |
67% |
|
Combined Cycle |
7,394 |
28% |
29% |
1% |
|
Gas Turbine |
2,536 |
1% |
2% |
1% |
|
Gas Steam |
5,723 |
17% |
17% |
0% |
|
Coal |
15,488 |
46% |
37% |
-9% |
Note: Based on 31 Live Power monitored thermal dispatchable plants in SPP totaling 33.3 GW thermal dispatchable capacity
Want to learn more? Log in to read the full market driver alert to explore the numbers further.
Have questions or want to take a deeper dive into the data? Let's discuss how our transmission grid monitoring solution, Live Power®, could keep you a step ahead of market moves.

 About the author: Alex Bennitt is the product manager for Live Power and partner content integration at Yes Energy, where he utilizes a seven-year background in market fundamentals and Live Power operations to help steer product direction. In his free time, Alex is an avid skier who chases snow almost year-round.
