


Share this
by Alex Bennitt
This market driver alert (MDA) investigates four factors that contributed to high real-time pricing on June 20, 2023, in ERCOT.
ERCOT’s summer operations were tested in June 2023 when a prolonged heat wave settled over the state of Texas. The grid fared relatively well during a couple weeks of more than 75 GW peak loads, but on June 20, 2023, grid conditions got tight as net load peaked at 64.3 GW. Real-time (RT) settlement point prices (SPP) at North Hub peaked at $5,070.93/MWh.
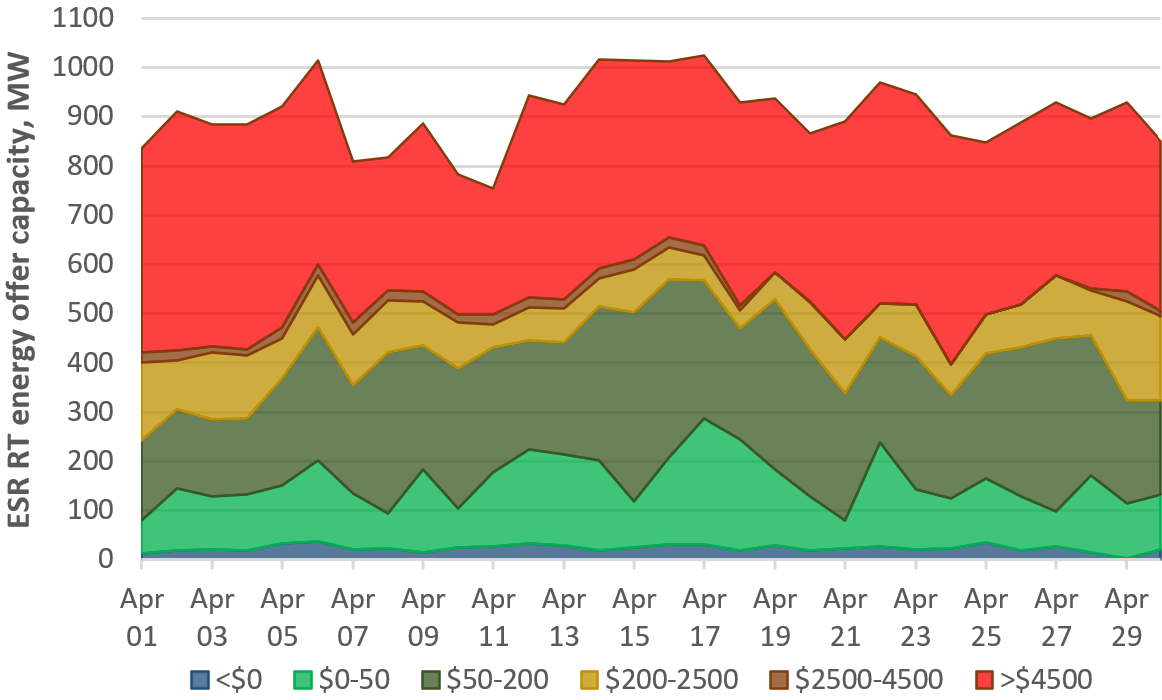
What drove prices so high? Low generation available to real-time security constrained economic dispatch (SCED) required the clearing of energy offers from battery capacity with ultra-high offer prices.
Figure 1: Daily SCED real-time ESR energy offers by price level, April 2023, MW
In our MDA, we investigate:
- Energy storage resource (ESR) offers and capacity
- Capacity available to participate in the real-time market
- ERCOT resource outage capacity
- ERCOT’s Ancillary Service procurement
Want to learn more? Read the full MDA here.
Have questions or want to take a deeper dive into the data? Let's discuss how our transmission grid monitoring solution, Live Power®, could keep you a step ahead of market moves.

We are now delivering comprehensive 60-second power generation and transmission data covering California and the broader Western power markets through our Live Power® solution! Read more in our press release.
 About the author: Alex Bennitt is the product manager for Live Power and partner content integration at Yes Energy, where he utilizes a seven-year background in market fundamentals and Live Power operations to help steer product direction. In his free time, Alex is an avid skier who chases snow almost year-round.
