


Share this
by Yes Energy on Jan 17, 2023
Renewable Generation Saved the Day in SPP and ERCOT
Market dynamics associated with severe weather storms such as Winter Storm Uri and Elliot tend to be complex. Because of the idiosyncratic nature of extreme weather events, market price formations aren’t always clear. To decipher Winter Storm Elliot’s impact on North American independent system operators (ISOs), Yes Energy’s market monitoring team analyzed the two events.
Although industry experts expected ERCOT and SPP to follow Winter Storm Uri’s disastrous trajectory during Winter Storm Elliot’s December 2022 bomb cyclone, our analysis shows that the northeast was hit the hardest. Large-scale outages across all ISOs were almost exclusively tied to gas generation, stemming from fuel supply issues and high gas prices. Renewable generation helped save the day in the SPP and ERCOT regions.
Winter Storm Uri Vs. Winter Storm Elliot
In February 2021, Winter Storm Uri severely impacted Texas and the southeast US, causing major issues for the ERCOT and SPP. During Uri’s four-day reign, coal piles froze, and the natural gas supply was cut off due to frozen infrastructure, leading to blackouts for 9.9 million across Texas and the southeast. Uri was the costliest winter storm on record at $196.5 billion.
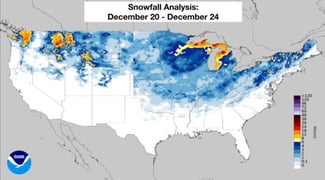 While Uri hit the ERCOT region the hardest, Winter Storm Elliott challenged multiple regions, with blizzards, high winds, snowfall, and record-cold temperatures. While the duration of Eliott’s December 2022 storm was similar to Uri, Elliott’s movement across the US impacted each region for one to two days, with record-setting temperature drops in multiple spots.
PJM
Since PJM regularly sees below-freezing temperatures, has the largest capacity and reserve markets in the world, and receives weekly fuel assurances for thermal generation, we expected PJM to fare better during Elliott. As Elliott descended on the region, PJM had a forecasted load of 127 GW, was operating conservatively, and had set up its first conservation alert since the 2014 polar vortex. It had called 165 GW into operating capacity (29 GW in reserve), which is much higher than PJM’s nominal reserve amount.
However, Elliot brought PJM the most dramatic temperature drop in a decade, with a record-setting 29-degree temperature drop in a 12-hour period. With 29 GW in reserve, PJM thought it would be able to handle the load. However, as it called in reserves, the majority of its fleet failed to perform. In total, with derates, PJM lost about 57 GW of generation, with 92% of forced outages with little to no notice. As PJM's total fleet capacity is 186 GW, the resulting impact was the equivalent of PJM losing 30% of its entire generation fleet.
Further analysis finds that most of the outages came from the natural gas plants, which accounted for 63% of all outages. The storm and the rapid onset of cold temperatures heavily impacted natural gas production, particularly in the Marcellus and Utica basins, which led to a significant loss of gas supply for all downstream gas consumers. Supplies from the Appalachian Basin shrank 27% from usual levels and well freeze-offs resulted in production drops by more than 20% in Pennsylvania and more than 50% in Ohio.
While these fuel supply issues played a key role in the cause of these generation outages, the failure of plant equipment, failure to start, and temperature-related failures have been cited as the greatest cause of outages. Although this didn't result in any load shed, it did get dangerously close, with the region essentially running on fumes.
Since Elliott, FERC/NERC has started a joint nationwide investigation into PJM; estimated market penalties for generators are at $1.8 billion. PJM is also re-evaluating its load forecast approach as well as petitioning NERC for stricter weatherization standards and faster implementation in order to combat equipment failures.
ERCOT
Days before Elliot hit Texas on December 23, 2022, concerns about system reliability pushed short-term forward markets to levels above $400/MWh. Although Uri caused the worst reliability performance in ERCOT history, the grid generally fared well during Elliot, thanks to warmer minimum temperatures and a shorter duration of the storm.
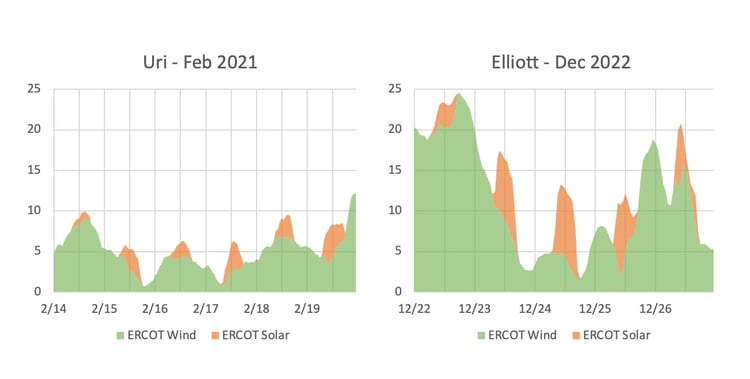
During Uri, load was forecasted to reach a winter peak of about 77 GW, but didn't reach those levels due to load shedding. During Elliott, meanwhile, load levels hit an all-time winter peak of 74.1 GW (five-minute interval). Strong renewable generation during peak load played a big role in keeping net load levels in check during Elliott, compared to weak renewable generation (less than five GW) during Uri. Warmer temperatures, shorter duration, and a lack of snowfall during Winter Storm Elliott helped keep renewable generation healthy.
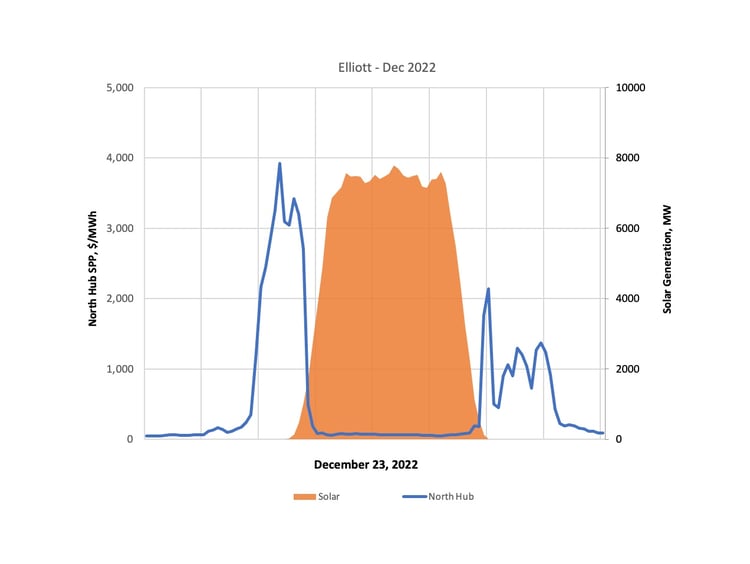
From our analysis, it appears solar played the biggest role with an about eight GW peak. As wind production fell and net load ramped, ERCOT saw $3,000 real-time pricing before sunrise. After the sun rose, prices dropped below $100 within 90 minutes. The opposite then occurred as the sun set: about eight GW of solar rolled off the grid in 90 minutes, sending prices back over $1,000.
As we can see in the chart below, installed wind and solar capacity contributed to the strong renewable generation during Elliott, with about 12.4 GW of wind and solar additions between the two storms. As renewable penetration continues to increase, the pressure on the grid to perform during pre-sunrise and post-sundown hours will continue to be a concern.
ERCOT's dispatchable generation capacity got tight for a quarter of the day on December 23, with ERCOT's physical responsive capability (i.e. what the grid can generate in a quick time frame) spending around seven hours below 5,000 MW. ERCOT's real-time online capacity (i.e. what the grid can generate on a longer time frame), only spent about three hours below 5,000 MW, triggering some scarcity pricing. This translates to significantly less scarcity pricing during Elliot, which saw around $500 average real-time premiums for one day, with relatively normal pricing on others.
Poor planning for extreme operation scenarios, like Uri, caused load shedding to affect natural gas throughput in Texas. When production drops in the largest natural gas field in North America, it leads to extremely high pricing that other states pay for, with premiums reaching 100 times levels in Texas and other parts of the country. During Elliot, we saw healthy natural gas supply, with only a $1 premium (about 25%) during the storm.
During Winter Storm Elliott, online reserves never dipped below 3,000 MW, thanks to growth in thermal/renewable capacity, lower-than-normal thermal outages, healthy natural gas supply, and decent wind/solar production. Small changes in thermal outages or renewable production (including a higher load, poor solar performance, and/or snowfall), however, could have put ERCOT reliability at severe risk.
SPP
During Winter Storm Uri, Southwest Power Pool (SPP) experienced single-digit and negative temps, causing fuel supply issues and frozen infrastructure. Generation that was scheduled to show up didn’t, leading to two energy emergency alerts (EEA) level 3, which led to load shed directive and short periods of blackouts. Fuel availability was a major factor in how this region behaved during winter storm Uri, similar to ERCOT’s challenges. Following Uri, SPP implemented changes around fuel supply and resource adequacy, many of which are currently set to complete in 2023.
Our analysis shows that SPP coasted through Elliot, thanks to solid wind production and relatively low natural gas capacity outages. Although Elliot moved in swiftly, setting temperature drop records across the US, the minimum temperatures observed weren’t as low as winter storm Uri and only persisted for one to two days.
In the slide below, we’ll look at values during the peak load day during each winter storm. During Elliott, SPP was 6.3 degrees warmer. Despite those warmer temperatures, SPP hit an all-time winter peak load at 46.9 GW, though load was shed during Uri. The average renewable generation during the peak load was 17 GW during Elliot or 13 GW higher than average wind generation during Uri. This factor kept net loads below 30 GW, well within manageable conditions for SPP. 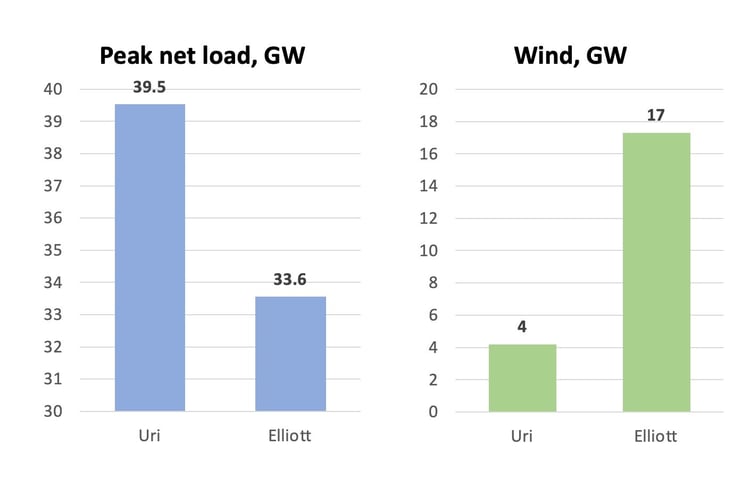
The day after load peaked, net loads peaked as wind fell off due to cold temperatures. With Elliot’s net load peaking at 33.6 GW (5.9 GW lower than Uri’s peak of 39.5 GW), load didn’t fall off as quickly in SPP. Wind generation remained above 10 GW to keep net loads manageable.
A large contributing factor to SPP’s load shedding during Uri was offline gas capacity, which reached 16 GW on the day load shedding occurred and hit a maximum of 19 GW a couple days later. During Elliot, gas outages were much lower at eight GW.
During Uri, SPP relied heavily on imports to reduce the amount of load shedding, with peak imports coming in at negative six GW. Negative values in the chart above indicate that they imported power. During Elliot, on the peak net load day, imports peaked at negative 1.6 GW.
While many of the SPP fundamentals followed a similar pattern as ERCOT, SPP coasted through an all-time winter peak load thanks to ample wind generation, resulting in less net load and imports from other ISOs.
CAISO
On December 19, 2022, in California, temperatures dropped from 62 to 31 degrees overnight, causing heaters to ramp up demand. During this same period, wind generation dropped around 750 MWs, and imports dropped over 5000 MW, leading to price spikes. As the California Independent System Operator (CAISO) tried to shift its generation stack to meet dropping supply, it turned to natural gas-fired generation as the marginal unit. The elevated costs of natural gas drove the marginal energy cost (MEC) and locational marginal prices (LMP) up across the region during certain intervals throughout this week.
Natural gas plant outages jumped during this same timeframe, leading to natural gas stranded at non-operational plants. The Russia and Ukraine conflict also impacted fuel availability, as did CAISO’s placement on the end of the natural gas pipelines, which reduced the availability of this fuel as demand increased leading up to Winter Storm Elliott. The price of gas on average during December 2022 was up nearly 300% of average.
High fuel prices, reduced import supply due to the reliability needs of neighboring regions, and a reduction of renewable generation were major drivers of CAISO’s behavior going into the holiday week. Overall, it was a perfect storm of variables leading to extremely high prices during this week.
ISO-NE and NYISO
Last, but not least, let’s evaluate New England. Although other areas of the country bring gas in from multiple directions, New England's location is at the end of the pipeline. Since gas goes to homes before generators, each winter there’s concern over constrained gas pipelines and gas supply shortages. However, our Elliot analysis shows that price was the primary issue with this storm, not gas supply shortages.
On December 24, gas prices shot up to $35 per MMBTU, whereas oil stayed steady at around $23. As a result, running on oil became more economical than running on gas (accounting for heat rates.) In fact, oil generators were marginal in New England during this event as well as for several days thereafter.
But then generation fell short of the load-plus-reserve requirement, and New England had its first winter capacity scarcity event in nearly a decade. This triggered New England's pay-for-performance penalty structure, with an estimated $39 million in penalties and real-time prices reaching nearly $3,000 per megawatt hour.
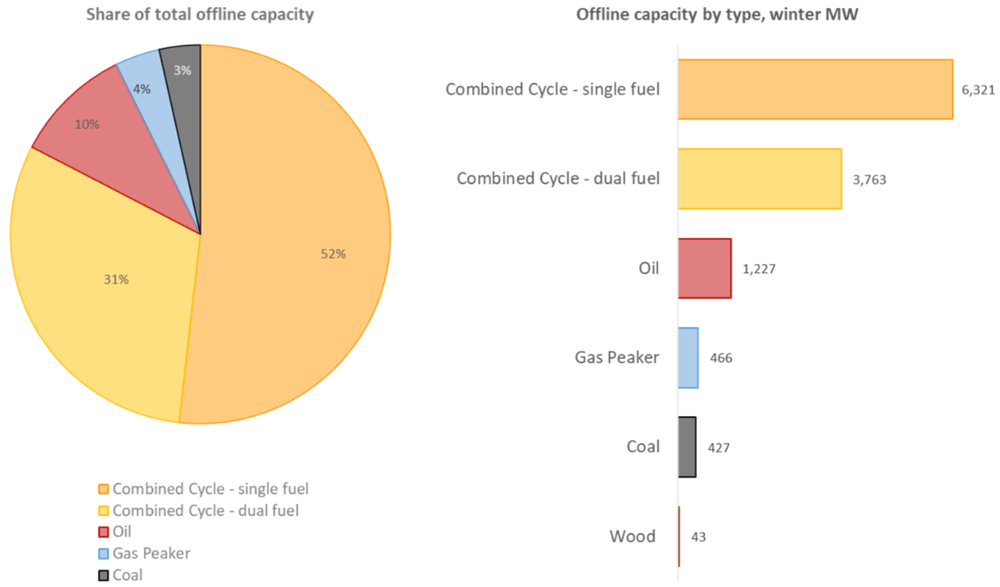
The scarcity event lasted for 2.5 hours on Christmas Eve, prompting emergency procedures to prevent load shed. 2,150 megawatts of generation unexpectedly went offline – generation that was scheduled to come online but didn’t. There was also a reduction in imports, pushing New England into a winter capacity scarcity event – an issue of timing as opposed to fuel supply issues. This shortage occurred while the majority of gas was offline. In the chart below, our Live Power data shows us that the offline gas units were mainly combined cycle – a breakdown that ISOs aren’t able to provide.
For a more detailed Live Power analysis of Elliot’s impact on NEISO, download our white paper.
To Sum It All Up
Although industry experts expected ERCOT and SPP to follow Winter Storm Uri’s disastrous trajectory, our analysis shows that the northeast was hit the hardest during Elliot’s December 2022 bomb cyclone.
SPP unexpectedly coasted through an all-time winter peak load while PJM’s CCGT fleet failed during an abnormally high holiday load. As we scrutinized ERCOT’s performance, online reserves were never severely depleted as solar played a large role in helping to maintain reliability. Meanwhile, day-ahead economics left gas out of the cold weather equation in NEISO and outages pushed them to capacity condition.
Although the varying nature of Winter Storm Elliott vs. Winter Storm Uri makes a direct comparison between the two storms challenging, evaluating differences between the two reveals that renewable generation helped save the day in the SPP and ERCOT regions.
How Yes Energy Can Help
Yes Energy provides the most comprehensive, robust, and high-quality energy data and analytics tools available, empowering you to navigate highly complex and dynamic power markets. To learn how we can help you maximize your bottom line, schedule a demo.

