


Share this
and Jack Farley (Live Power CEO)
In the Southwest Power Pool (SPP), wind generation makes up a large share of supply and has an outsized effect on pricing outcomes. When actual wind output materially overperforms the day-ahead forecast, it is typically a bearish factor for real-time prices in SPP. However, when actual wind output materially underperforms the day-ahead forecast, the impact on real-time prices is mixed. Why? Because some wind output under-performance is “natural” and some is “humanmade”, i.e., caused by curtailment of wind production. The natural, weather-driven under-performance is due to less
favorable wind conditions than forecasted – these events arise solely from an error in wind forecasting. The human-made underperformance is due to economic or transmission (reliability-driven) curtailment.
- Economic curtailment occurs when the price at a wind node is at, or below, the breakeven production cost for a wind project. For wind projects that are more than 10 years old and have aged out of PTC eligibility, the breakeven price is ~$0/MWh, or the negative price equivalent to the value of Renewable Energy Credits associated with production. Every month, more projects age out of PTC eligibility and must economically curtail output when real-time prices reach ~$0/MWh. In 2022, 3.2 GW of SPP wind capacity will reach its eleventh year of operation – this is in addition to the 4.9 GW of SPP wind capacity that has been operational for over 10 years (and is assumed to have lost eligibility for the PTC).
- SPP wind curtailment via redispatch or manual instruction is necessary when heavy wind production reaches the limits of transmission capacity.
Events in which wind falls significantly below the day-ahead forecast due to curtailments are NOT typically opportunities to buy balance-of-the-day (bal-day) power (they do not reliably result in higher-than expected real-time prices). Conversely, when wind production underperforms the day-ahead forecast due to less favorable wind conditions, these natural events are typically an opportunity to buy bal-day power. Thus, to see the true wind signal in the real-time market, it is important to filter out the curtailment noise.
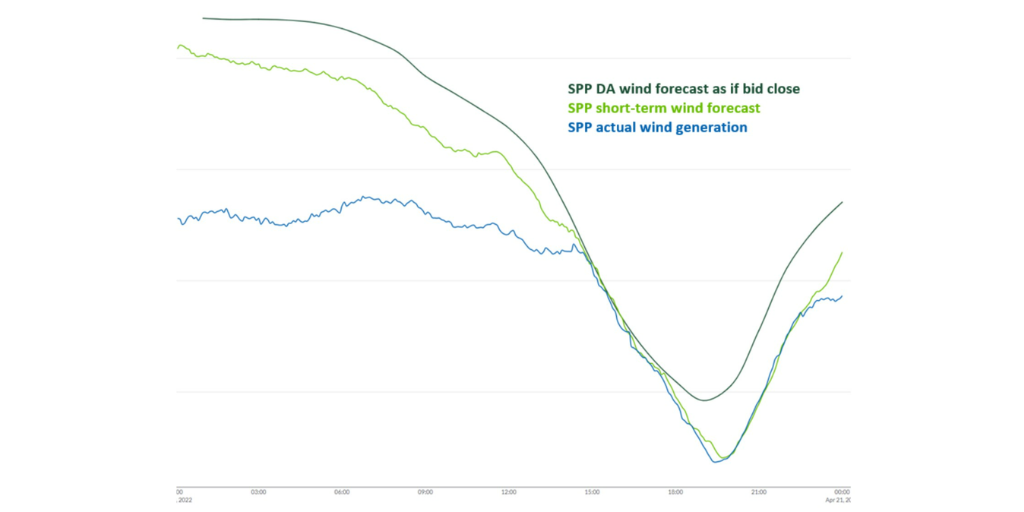
Typical real-time market signal sent when actual wind output is higher than, in-line, and lower than the day-ahead wind forecast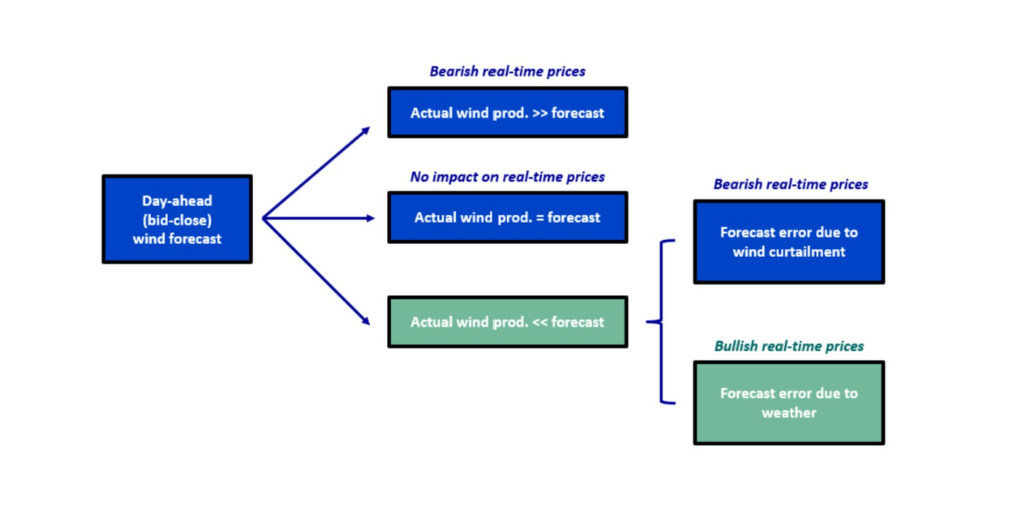
Live Power now covers 79 power plants comprising 40 GW of generating capacity in SPP – 57 of these (16.6 GW) are wind facilities. Live Power 60-second production data can inform trading decisions with real-time generation visibility. We used a combination of Live Power and Yes Energy data to back-test a hypothetical trading strategy founded on our expectation that a large bid-close wind forecast error would often result in higher real-time prices, i.e., a negative DART spread (the bid-close forecast is the wind forecast available when day-ahead bids are due; it is the day-ahead wind forecast utilized in our analysis). We first used Yes Energy data to conduct a historical analysis that led to the development of the conditions for our hypothetical trades. Then, using (what would have been) real-time indicators from Live Power and Yes Energy, we tested our strategy during March, April, and May of this year. The following blog will take you through what we learned and how Live Power data proved to be a highly valuable tool to screen out human-made wind curtailment.
Would you like to learn more about the data used in this analysis?

STEP 1: HISTORICAL DART ANALYSIS AND DEVELOPMENT OF TRADING CONDITIONS
Our goal was to find a trading strategy that would exploit differentials in SPP day-ahead and real-time prices, based on the real-time bid-close wind forecast error.
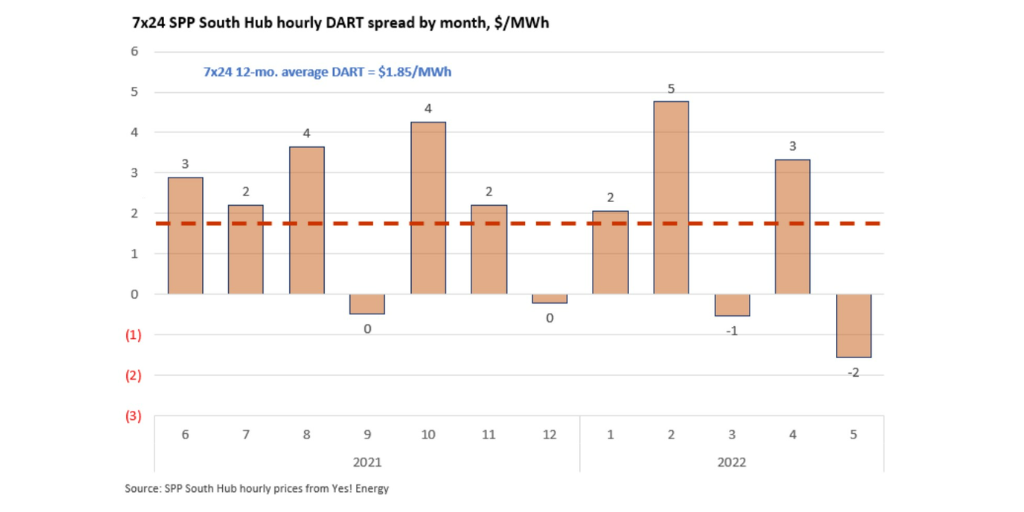
First, we used Yes Energy data to conduct an analysis of the day-ahead vs. real-time prices (DART spreads) over the past 12 months. We found the following.
DART SPREADS ARE GENERALLY POSITIVE OVER THE LAST 12 MONTHS.
HOWEVER, IN HOURS WHERE ACTUAL WIND OUTPUT IS <90% OF THE DAY-AHEAD FORECAST, THE HOURLY DART SPREAD IS GENERALLY NEGATIVE.
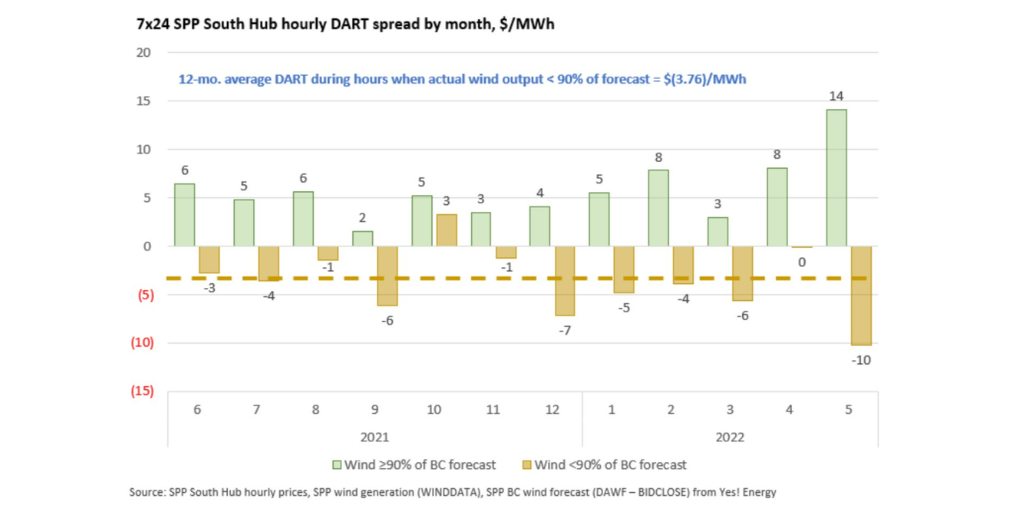
We also observed that while DART spreads were negative during low-wind hours on average, a large wind forecast error does not always indicate a very negative DART spread. Trading on this indicator alone would not be sufficient to generate reliable results.
WHEN WIND OUTPUT IS HIGH AND RT PRICES ARE LOW, SOME WIND PROJECTS WILL CURTAIL OUTPUT – THIS IS NOT CAPTURED IN THE BID-CLOSE FORECAST.
.png?width=1024&name=Bearish%20(1).png)
When wind curtailment (either economic or reliability-driven) is significant, RT prices are generally low. A large bid-close wind forecast error that is a result of wind curtailment will not drive a RT price spike. However, when a significant wind forecast error is not the result of curtailment, and is instead a true forecast error due to unfavorable wind conditions, then RT prices can indeed spike.
 DART SPREADS FAR MORE NEGATIVE WHEN HUMAN-MADE WIND CURTAILMENTS ARE SCREENED OUT – NATURAL WIND UNDERPERFORMANCE CORRELATES WITH HIGHER REAL-TIME PRICES
We found two conditions that tend to indicate a largely negative DART spread:
- Wind output is less than 90% of the bid-close forecast, and
- There is no significant wind curtailment (forecast error is a true weather-driven miss)
STEP 2: FIND THE DATA TO INDICATE PRESENCE OF THESE CONDITIONS
In real-time, a trader will need access to the most up-to-date information to spot the truly bullish wind signals.
WIND OUTPUT AND BID-CLOSE FORECAST DATA FOR CONDITION 1
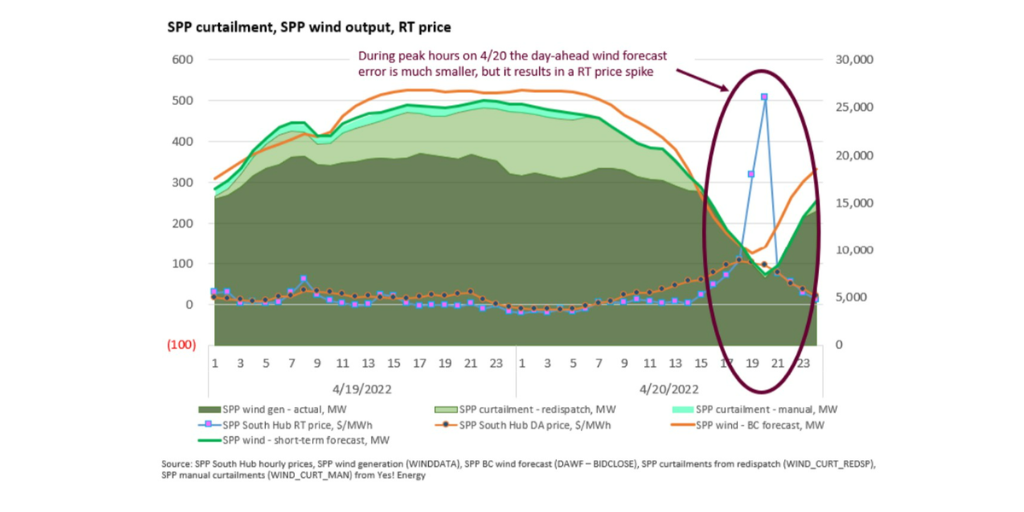
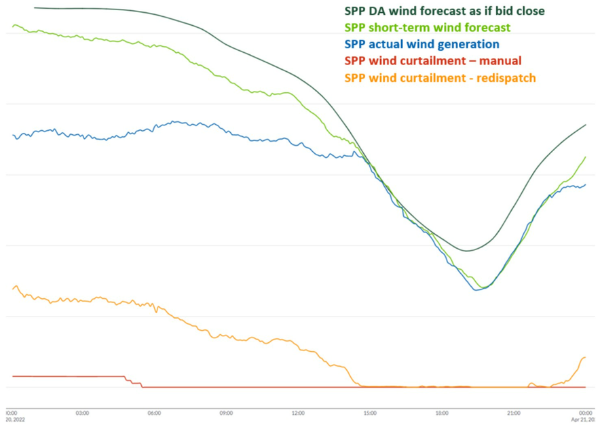
Yes Energy provides SPP reported wind fleet production and the bid-close forecast (among other wind forecast series). Here is the wind forecast vs. actual on April 20th:
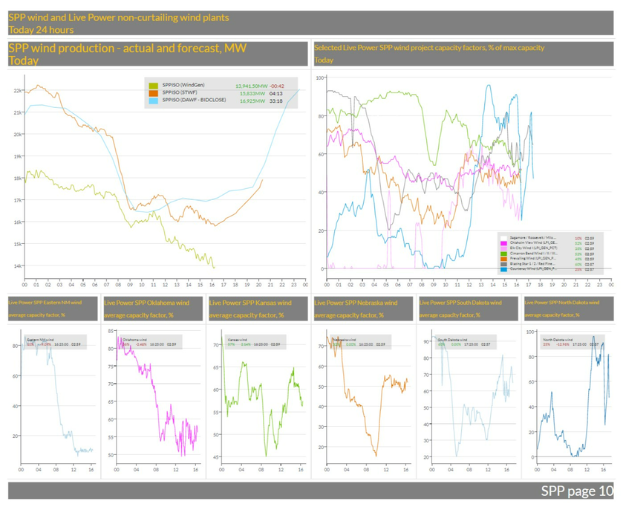
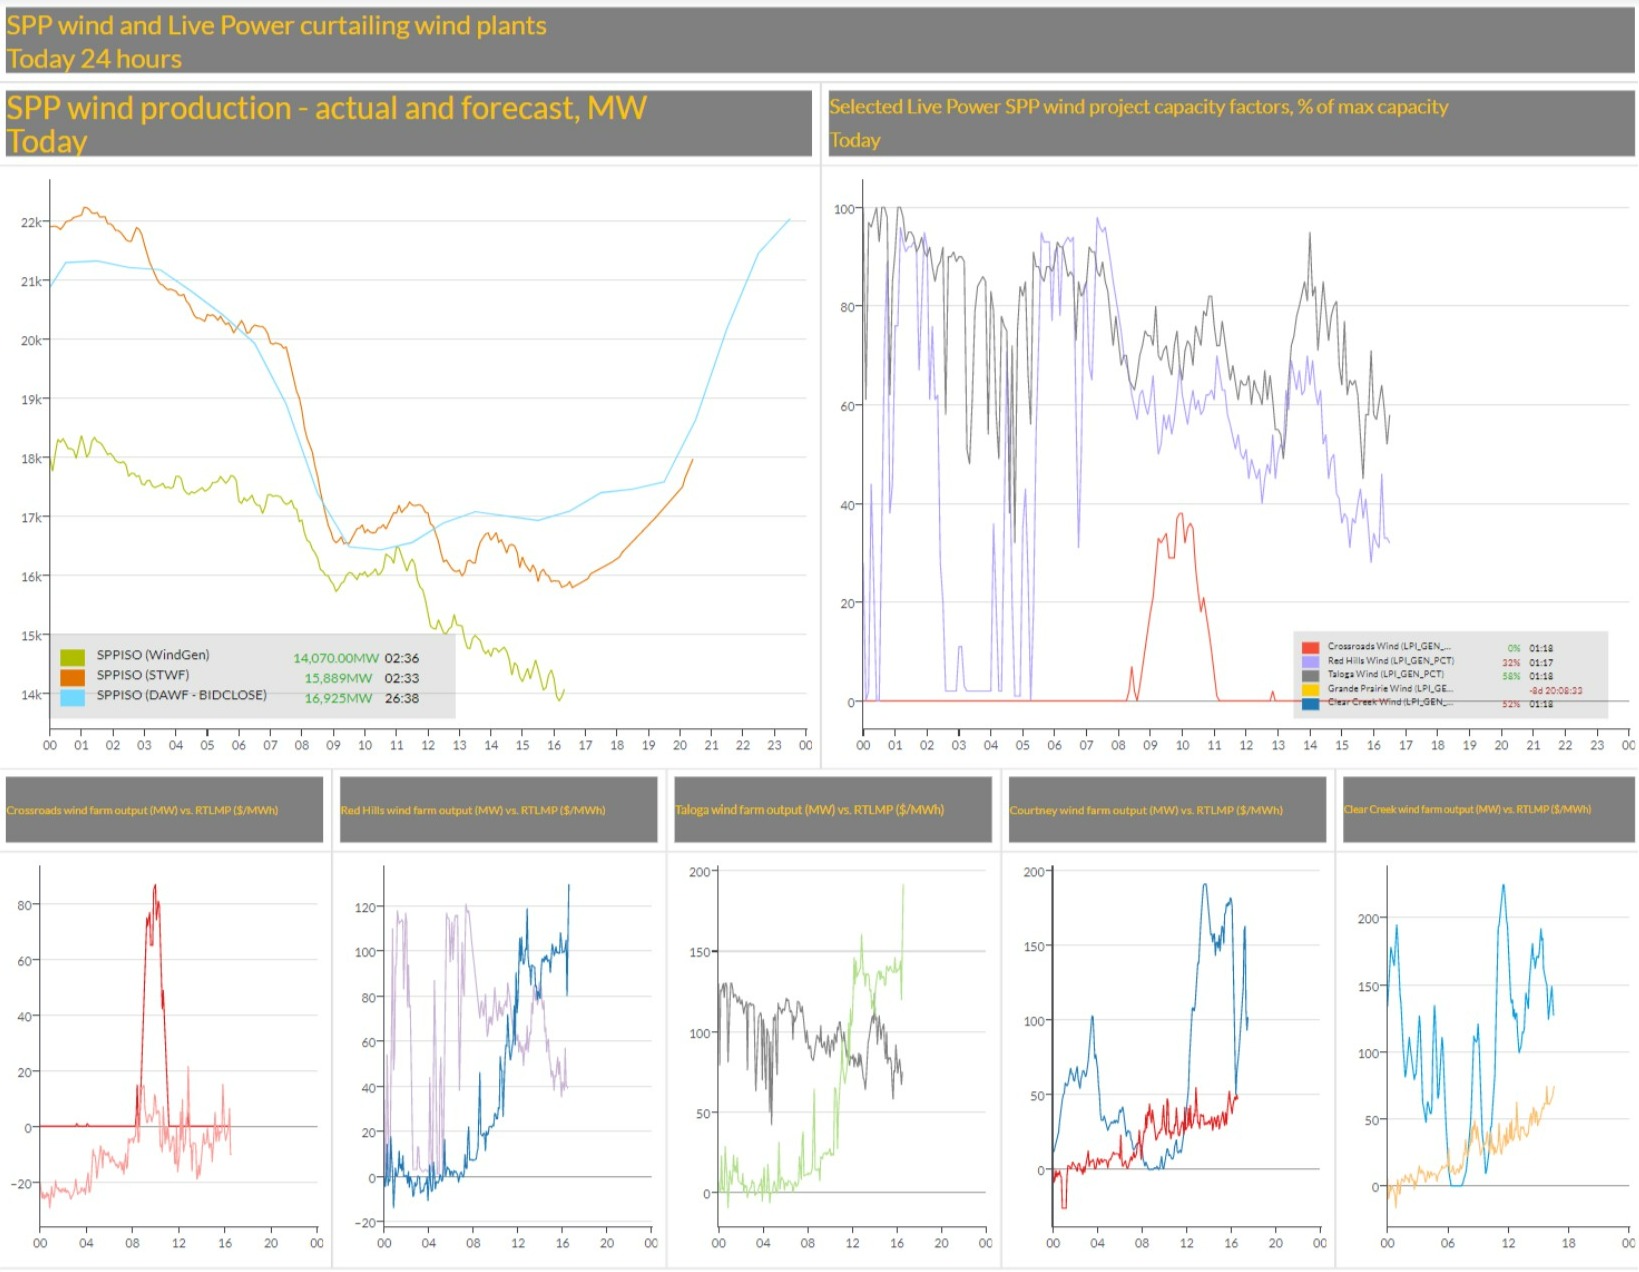
Note: A great way to track the fleet output vs. the forecast in real-time is to look at the new QuickSignals Grid View Dashboards – check out the SPP dashboard page 10 to see fleet production vs. day-ahead and short-term forecasts. Below is a sample from 6/24:
WIND CURTAILMENT DATA FOR CONDITION 2
For the second condition, a trader would need to know if there is significant wind curtailment. In SPP, there are three different types of curtailment: manual, redispatch, and economic. Manual curtailments occur through system operator instruction and are induced to maintain system reliability. Redispatch curtailments occur when wind resource offers fail to clear the real-time market. These types of curtailment reflect the physical limitations of the grid and/or over-supply conditions. Economic curtailment occurs when the price at a wind node falls below the marginal cost of production for the associated facility, when operators voluntarily reduce output to avoid losses on energy production (net of REC revenue). Wind projects that are no longer eligible for the wind PTC will have a higher marginal cost of production than those facilities that still receive a PTC. Curtailments reflected in data from the SPP ISO (manual and redispatch) likely understate the actual level of total curtailment including the economic sort – particularly when overall wind production is high.
The historical analysis we conducted in Step 1 used redispatch curtailment data from SPP ISO; here is April 20th with SPP curtailment data:
Yes Energy publishes SPP-reported reliability curtailment data the day after the operating interval – it is not available in real-time. This is where Live Power data comes into play – Live Power real-time production and capacity factor data can be used to estimate whether significant curtailment is taking place in SPP.
To utilize real-time Live Power data, we grouped the wind projects covered by Live Power into two groups – those that we expect to economically curtail output (these projects are estimated to no longer have PTC eligibility based on their in-service dates), and those we do not expect to economically curtail output (projects less than 10 years old). Because both reliability-driven and economic curtailment are most likely to occur when wind production is strong, we can reasonably expect that high levels of reliability curtailment will coincide with significant economic curtailment. We then compared the average capacity factor of each group under varying levels of SPP-reported curtailments (both manual and redispatch).
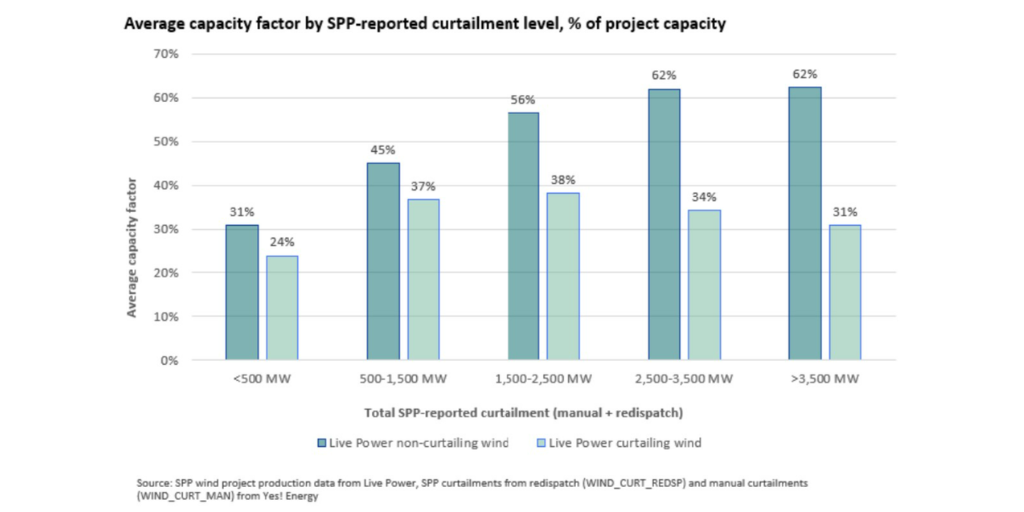
We concluded that there was significant curtailment in SPP when the average capacity factor of the curtailing group was ~20 percentage points below that of the non-curtailing group.
.png?width=500&name=SPP%20Curtailment%20%20(2).png)
With the Live Power curtailment indicator, we had what we needed to replicate our hypothetical trade.
Note: The new QuickSignals SPP Grid View Dashboard includes a tile covering wind curtailment (SPP page 11) – it shows the RT output vs. nodal prices for a selection of projects that exhibit curtailment. Use this pre-set tile or customize to add more projects or project groupings. Below is a sample from 6/24:
STEP 3: DEVELOP AND BACK-TEST TRADING STRATEGY
WE DEVELOPED AN HOURLY MODEL FOR MARCH, APRIL, AND MAY OF 2022 THAT INCORPORATED OUR TWO TRADE CONDITIONS
- Condition 1: Wind output is less than 90% of the day-ahead forecast, and
- Condition 2: There is no significant curtailment (average capacity factor of Live Power non-curtailing wind projects is less than 20 percentage points greater than the average capacity factor of Live Power curtailing wind projects)
AND THE FOLLOWING STRATEGY
When both conditions were met, we modeled buying a 100 MW bal-day position. A bal-day position is a swap in which the buyer agrees to buy a given volume at a fixed price, and sell the same volume at a variable price. In this example, the variable price would reflect the average of the actual real-time prices for the remaining hours in the day through hour 24. The fixed price, determined every hour, is assumed to reflect a market-settled price for the remaining hours in the day through hour 24.
When both conditions no longer held, we took an offsetting bal-day position.
For example, if in HE 14 our two conditions were met, we would buy 100 MW at the current (in HE 14) bal-day price for the remainder of the day, i.e., buy the 11 remaining hours (including HE 14).
If then in HE 19 the two conditions no longer jointly held, we would then sell 100 MW bal-day at the current price for the remainder of the day, i.e., sell the 5 remaining hours (starting with HE 20).
BASED ON THIS RATIONALE
Whenever the real-time wind output is less than 90% of the forecasted day-ahead wind output, AND there is no significant wind curtailment present (“significant” being defined as a 20-percentage point difference in the average capacity factor of the Live Power curtailing wind projects and the average capacity factor of the Live Power non-curtailing wind projects), a reasonable expectation is to see the bal-day prices move higher. When one or both conditions reverse, then prices can reasonably be expected to decline.
AND USING A FEW ASSUMPTIONS
- When conditions were met, we assumed the trade would start at the beginning of that hour.
- When conditions ceased to hold, we assumed the offsetting trade would be executed at the beginning of that hour.
- Since historical bal-day (fixed) prices at every moment of every day cannot be revealed publicly, we used proxies:
- When buying the bal-day swap, the assumed bal-day (fixed) price was the average DA price for the remainder of the day including the current hour (to simulate bal-day prices before they spike due to the change in system conditions).
- When selling the bal-day swap, the assumed bal-day (fixed) price was the average RT price for the remainder of the day starting in the previous hour (to reflect higher prices in the market as other participants are still unaware that conditions have changed).
THE RESULTS ARE ENCOURAGING
Disclaimer: The above analysis is an illustrative example, and is not to be used or interpreted as trading advice..png?width=1024&name=Summary%20(2).png)
Live Power’s generation production data reflects the most up-to-date system conditions and informs real-time decisions. Yes Energy’s comprehensive real-time ISO, weather, FERC, and fuel data complement Live Power series. Together, they can give you the tools to most accurately analyze and act upon real-time supply trends.
Would you like to learn more about the data used in this analysis?

1 Broker and online exchange bid-offer data for bal-day products is subject to confidentiality protections.
