


Share this
by Sarah Hatch
Let’s talk about what electricity grid congestion is, what causes it, and how power market participants can respond to it. This ensures that the power grid continues to operate safely and reliably.
How Does Electricity Move?
First, let’s explore how electricity flows. Because electrons are invisible to the naked eye, let's use an analogy. Picture electricity flowing like water. Electricity flows through transmission lines across the grid the same way water flows through a system of connected pipes.
When a person turns on a faucet along the system, water will drain out of the pipes into a sink. Similarly, when someone turns on a light switch in their home, electricity “drains” into their home as a light source.
Just as some pipes are larger than others and can hold more water, some power transmission lines are larger and can handle more electricity.
To understand electricity grid congestion, you need to know that:
- Transmission lines have a maximum amount of electricity that can safely flow through them.
- The fluidity of electricity and the need to largely produce and consume electricity at the same time make it a challenging commodity to control.
Why Do We Need to Control How Electricity Flows Across the Power Grid?
Electricity moves through a vast network of interconnected power transmission lines and equipment. This makes up the system or power grid.
System operators (Independent System Operators [ISOs] or Regional Transmission Operators [RTOs] in competitive power markets) need to monitor and control how electricity flows through the grid to ensure safe, reliable service to all their consumers.

What Is Grid Congestion?
Congestion on the power grid can occur when a piece of equipment on the system exceeds its capacity. Capacity is the amount of electricity that can safely flow through a transmission line or other equipment. System operators must monitor the capacity limit of a transmission line because if more electricity pumps through a piece of equipment than it can hold, it could damage the equipment, cause a power outage, or spark a fire.
When a line or piece of equipment has too much electricity flowing through, it’s called grid congestion. Similar to a traffic jam with too many cars trying to rush along a narrow highway, congestion in a power grid means that there are too many electrons flowing through a line.

What Happens When There’s Electricity Grid Congestion?
ISOs and RTOs have to keep the power grid operating safely, and they do this through contingency planning.
ISOs and RTOs have mathematical models that they run both in the day-ahead and real-time power markets to identify areas that might experience congestion or some other reliability issue. When a model finds a potential issue, the ISO or RTO puts a constraint on the system. A constraint is how the system operators identify a piece of equipment that is in jeopardy of having too much power flowing across it, or in other words, being congested.
While it’s difficult to manage electricity flow, system operators can influence how much electricity that generators produce.
In competitive power markets system operators can change the conditions on the grid by using pricing signals to show generators where the systems need more (or less) electricity. Higher prices incentivize generators to produce more electricity; lower prices discourage generators from producing more electricity.
How Do Locational Marginal Prices Differ Across Nodes When There Is a Grid Constraint?
We previously talked about locational marginal prices (LMPs). These price locations are used to send the varying price signals across the grid. Here’s how ISOs determine those prices.
The shadow price indicates how much money would be saved by relaxing a binding constraint by 1 MW. The ISO multiplies this price by a shift factor. Shift factors are a number between -1 and 1, and the ISO model also calculates these.
A node that a constraint highly impacts will have a larger absolute shift factor (closer to 1 or -1). This results in driving prices up or down in the areas of the grid that need to respond to alleviate the constraint.
ISOs alleviate a grid constraint when a physical entity (typically a power plant) on the grid changes its behavior in response to the price. For example, if an LMP spikes because of a constraint, a nearby power plant might ramp up its generation to sell electricity at that new higher price and make more money.
Conversely, if an LMP plummets, a power plant producing electricity might no longer find it profitable to run and would ramp down. An example of this is wind curtailment - when operators use feathering to slow or stop turbines in response to negative LMPs.
These changes help ease a constraint.
An Example of a Grid Constraint
Let’s look at an example of a constraint on the power grid. Let’s look at Pennsylvania just outside of Scranton on an overcast Wednesday with seasonable weather, and let’s zero in at around 5 a.m.
Diving into Yes Energy’s PowerSignals, let’s start with the Analytic Price Map and look at the Nodal Prices map layer. We see that prices in this whole region are relatively flat. If we toggle to see just the congestion component of the LMP, it’s just 37 cents per megawatt-hour (MWh) at all of these price nodes. However, at 5:05 a.m. this Lenox Constraint is put on the system, and the congestion price drops to -$660 on this node and surges to $944 on the other side!

Source: Yes Energy's PowerSignals
This is a clear signal that something is up. It shows that electricity needs to increase on the Northeastern side and decrease to the west of this constraint.
Let’s add the Transmission System layer to this map.

Source: PowerSignals
You can see that the constraint is on this 115 KV line, and the contingency for this constraint is this Etowanda-Hillside 230 KV line. This means that the ISO models have identified that should something happen to this 230 KV line to the north, then the electricity flowing from this power plant in between the two would then send too much of its electricity down to this 115 KV line. The ISO needs to ensure that less electricity runs from up here to down here to ensure this line stays safe and reliable.

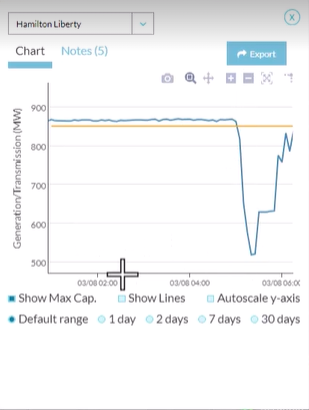
Now, let’s consider this Hamilton Liberty Combined Cycle Gas plant built in June 2016, right in the thick of things. Since it is a new combined cycle plant, it can ramp up and down quickly, which is one of its best features.
At 5 a.m. it’s earning about $21 per MWh, and it’s running at full power of 870 MWs. At 5:05 a.m. when the ISO puts this constraint on the system, the LMP at this price node becomes -$357 dollars, meaning that this power plant is now paying to put electricity onto the grid at this node. You don’t have to be a business wizard to know that is not a good idea.

Source: PowerSignals
Looking at the generation chart, we can see that when this constraint hits the system, the power begins to ramp down, putting less electricity onto the grid, which is exactly what the ISO wanted to happen to keep that 115 KV line safe.
Source: PowerSignals
At 5:25 a.m., the constraint goes away. The ISO model saw the reduced electricity flowing on that line and no longer saw a risk for that 115 KV line, should that 230 KV go out it could handle the flow.

Source: PowerSignals
What do you think the Hamilton Liberty plant did at 5:25 a.m. when prices returned to a respectable $23 dollars? You got it – it started to ramp back up!
Conclusion
This is a simple example of how constraints and congestion keep the grid safe and reliable. There are constraints on the system most days, keeping everything working.
Power market participants use historical constraint information to analyze the conditions under which they might occur again. This helps power plant operators and dispatchers plan when they’ll run, and it helps identify areas of the transmission system that might need improvements so constraints don’t happen as often. It’s also a key component of a lot of power traders’ strategies.
Learn more about our PowerSignals product, and explore more of how the power grid works in our Power Generation 101 series.

About the author: Sarah Hatch believes that no one knows their ultimate potential. Whether it is through her work at Yes Energy or through her previous roles as a teacher, she finds purpose in helping people grow and push towards that unknown boundary. She holds an undergraduate degree in natural resources and a Master's of Education - both of which have come in handy at Yes Energy. In her free time, she enjoys reading, spending time with her family, and being near the ocean.
