


Share this
by Yes Energy
As data science and visualization platforms become more commonplace in trading organizations, our customers have asked for the capability to do a similar analysis in their own data visualization platforms.
Financial transmission right (FTR) traders have long enjoyed the ability to understand and anticipate market events by exploring the underlying market fundamentals in Yes Energy®’s user interface tools. Now you can visually analyze FTR market risk with Yes Energy’s Power Market Geo Dataset and FTR Positions Dataset, which are available through the Snowflake Marketplace. Combining this powerful data with other Yes Energy datasets can help FTR traders understand questions like:
- How can I visualize my FTR portfolio to identify concentration risk?
- How can I visualize my FTR risk calculations?
Visualize Concentration Risk
FTR traders have always been able to view the concentration of risk in Yes Energy’s user interface tools, but now they can do a similar analysis in data visualization tools like Tableau by utilizing the new Power Market Geo Dataset and FTR Positions Dataset in Snowflake. This allows FTR traders to supplement the Yes Energy market data with their own datasets for an enhanced view of their concentration risk or their competitor’s concentration risk.
Below are example visualizations built to analyze the volumetric risk concentration for an anonymous participant in the Midcontinent Independent System Operator (MISO). These visualizations are based on megawatt hours (MWhs), so they are agnostic to term and peak type.
Figure 1 represents the sink node concentration for the open FTR portfolios of one market participant. You can see that there is significant concentration in the Michigan and Indiana areas.
Figure 1: Sink Node Concentration
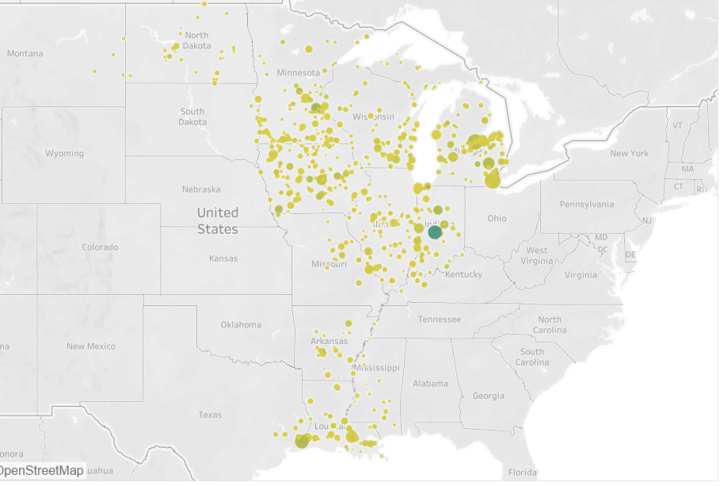
Source: Yes Energy
Figure 2 represents the source node concentration for the open FTR portfolios of one market participant. You can see that there is significant concentration in the Michigan and Indiana areas.
Figure 2: Source Node Concentration

Source: Yes Energy
Knowing that there’s a concentration in Michigan and Indiana, we’ve magnified the location to see more detail on the MWh size of the sink nodes in Figure 3.
Figure 3: Detailed Sink Node Concentration
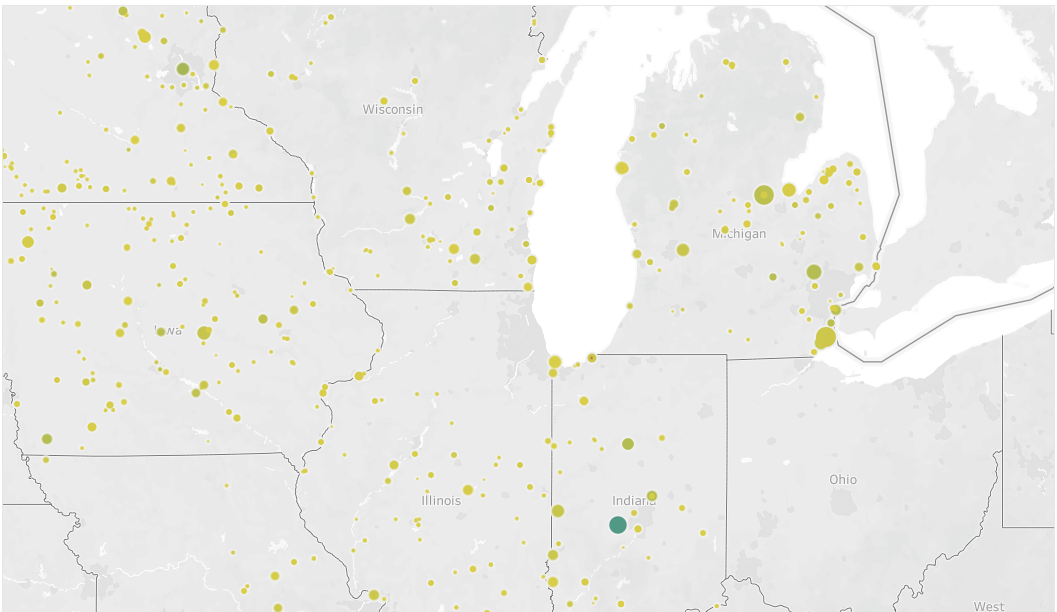
Source: Yes Energy
Visualize FTR Risk
Yes Energy’s Power Market Geo Dataset and Position Management™ also allow you to to build visualizations to view your FTR risk on a map.
Below is an example visualization that was built to analyze the FTR risk for an anonymous participant in Midcontinent Independent System Operator (MISO).
Figure 4 represents the risk by sink node for open FTR portfolios. The size of the circle is reflective of the risk at that sink node, irrespective of color.
Figure 4: FTR Risk
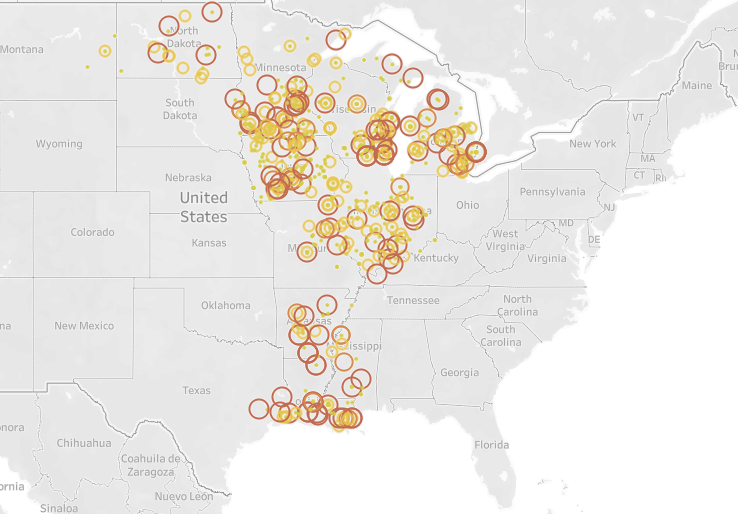
Source: Yes Energy
In addition to being able to visualize risk, we can calculate the risk as well as summarize by multiple attributes. Below is the risk for the open FTR portfolios by load zone, which is enabled through the Power Market Geo Dataset. Table 1 is a stress testing figure for a monthly liquidity period – i.e., worst month calculation.
Table 1: FTR Risk by Load Zone
| ZONE | STRESS |
| ALTW | $6,421,778 |
| AMMO | $5,608,912 |
| DECO | $5,202,796 |
| DPC | $5,173,526 |
| AMIL | $4,633,800 |
| MEC | $3,039,924 |
| ALTE | $2,306,701 |
| IPL | $2,209,830 |
| NSP | $2,008,943 |
| CIN | $1,766,477 |
Source: Yes Energy
Additional Dataset Benefits
Power Market Geo Dataset
The Power Market Geo Dataset provides comprehensive coverage of lat/long data for price nodes, power plants, and weather stations for all North American Independent System Operators (ISOs). This is all delivered to your team through either Snowflake or our DataSignals® Lake offering.
Position Management
Yes Energy’s Position Management solution provides the nodal power market Middle Office with a turnkey, consolidated solution for oversight of your trading activities. Yes Energy handles the deal capture of your FTR portfolios – by using our industry standard FTR risk and mark-to-market methodologies, you can be confident you’re getting accurate values for your reporting and ISO certification needs. Furthermore, it’s all delivered to your team through automated email reporting, a visual middle office dashboard, and easy-to-integrate data API.
FTR Positions Dataset
Yes Energy’s FTR Positions Dataset solution provides FTR trading organizations, investors, and regulators with unprecedented visibility into FTR market positions. Historically, only FTR trading organizations with large IT budgets have been able to build systems to gain visibility into their competitors’ positions, performance, and risk in the market. With FTR Positions Dataset, you can outsource this expensive data management, including trade capture, model remappings, and ISO changes.

