


Share this
by Cliff Rose
When siting an asset in the power market industry, understanding historical pricing at potential sites and the factors that influence those prices is crucial, since the past can serve as a valuable predictor of future profitability. As such, a careful analysis of historical pricing and drivers can guide developers in making informed decisions to maximize profitability and minimize risks.
Market-Wide Historical Price Analysis
Renewable energy developers, particularly those focused on wind or solar projects, need to understand historical production-weighted basis price differentials. This basis represents the production-weighted price paid to the resource at the delivery node versus the hub where the energy is sold via a power purchase agreement. Asset developers are typically responsible for covering these differences in off-take contracts.
Production-weighted basis is driven by transmission constraints between the generation node and the nodes comprising the hub indice. Below is a view of 2022 to 2023 average basis from all tradeable Electric Reliability Council of Texas (ERCOT) nodes to South Hub, production-weighted by ERCOT South Wind.
Production-Weighted Basis of ERCOT South Zone Nodes to South Hub, 2022 to 2023
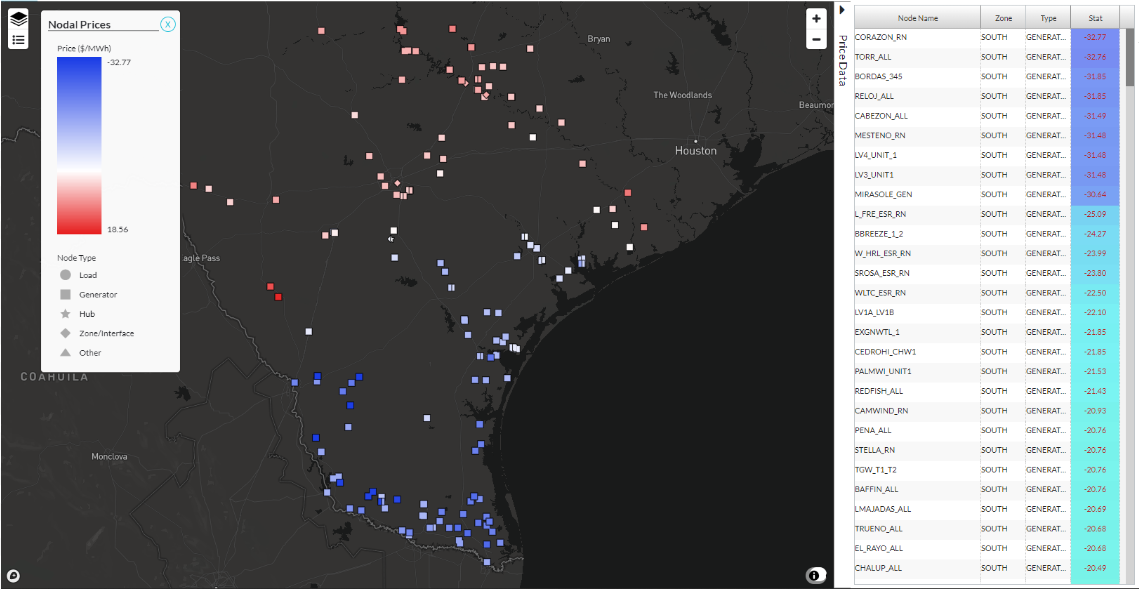
Source: Yes Energy, Long Term Price Map Module
Reviewing the same map with year-to-date 2024 data shows similar production-weighted basis patterns to 2024, with the exception of a few nodes in the far south and around Houston, which have flipped to positive production-weighted basis versus South Hub. Let's look into one of these examples to view the production basis between the REDFISH_ALL node and South Hub.
Production Weighted Basis of ERCOT South Zone Nodes to South Hub, January to July 2024
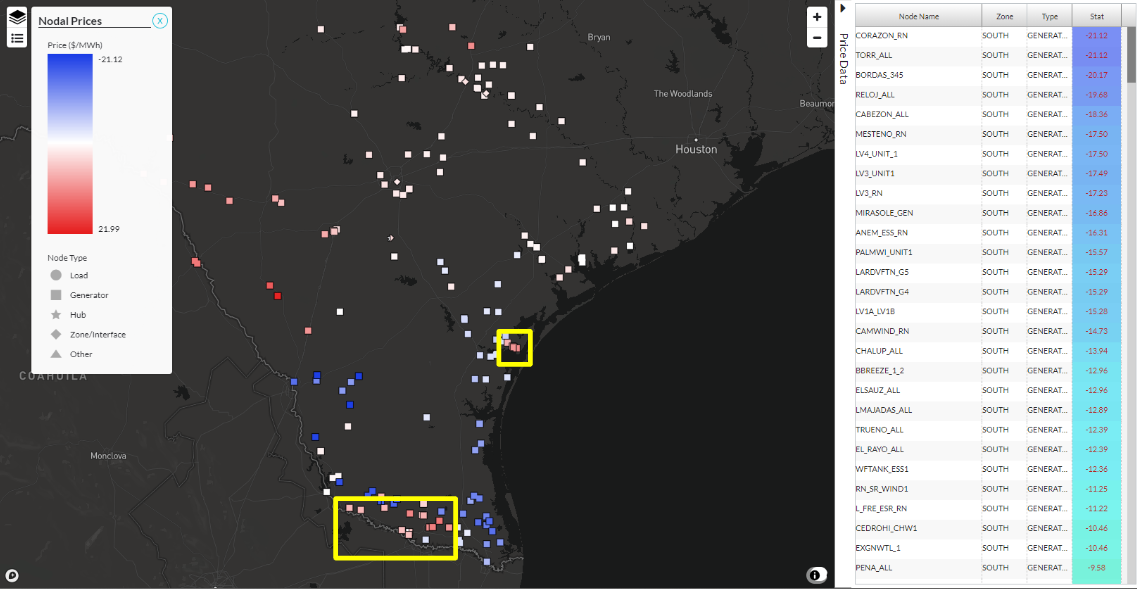
Source: Yes Energy, Long Term Price Map Module
Zooming in on a Specific Node
If we examine the wind-weighted basis since 2022 between the REDFISH_ALL and South Hub, we can see that the basis has historically been negative, particularly in the summer, with the August 2023 basis being particularly extreme.
Note that we’re now using coastal wind for production-weight, since that is a better proxy for production profile at the REDFISH_ALL node.
Monthly Production-Weighted Basis Between REDFISH_ALL and South Hub, 2022 to July 2024
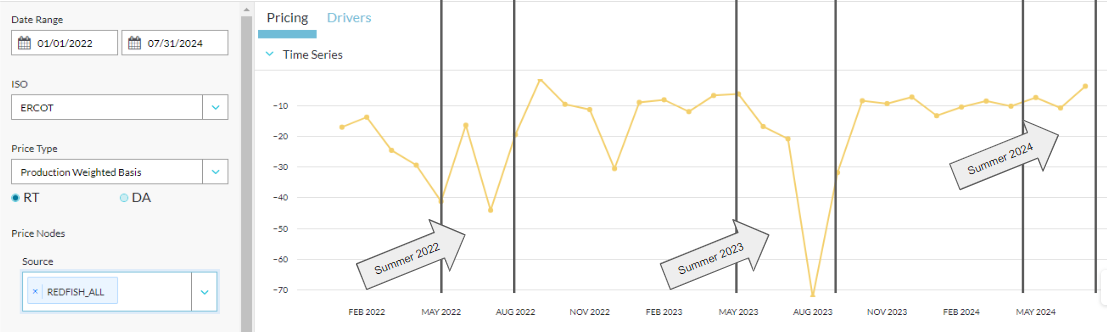
Source: Yes Energy, Site Pricing Profile Module
The extreme production-weighted basis between REDFISH_ALL and South Hub is most prevalent during the evening peak hours in the summer months.
12x24 Production Weighted Basis Between REDFISH_ALL and South Hub, 2022 to July 2024
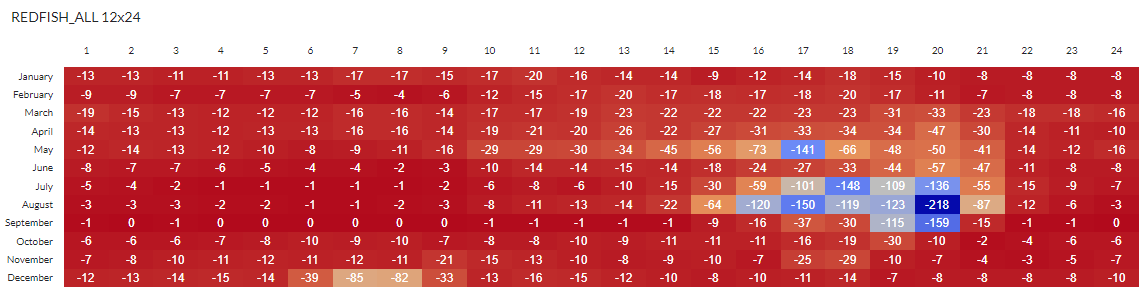
Source: Yes Energy, Site Pricing Profile Module
Historically, higher coastal generation output has driven congestion between the REDFISH_ALL node and South Hub. The chart below shows congestion pricing at the REDFISH_ALL node (shown in green) plotted against coastal wind generation reported by ERCOT (shown in blue) from the beginning of 2022 through July 2024.
As coastal wind generation increases, we see REDFISH_ALL negative congestion become more extreme and prevalent.
REDFISH_ALL Congestion (Green) and ERCOT Coastal Wind (Blue), 2022 to July 2024
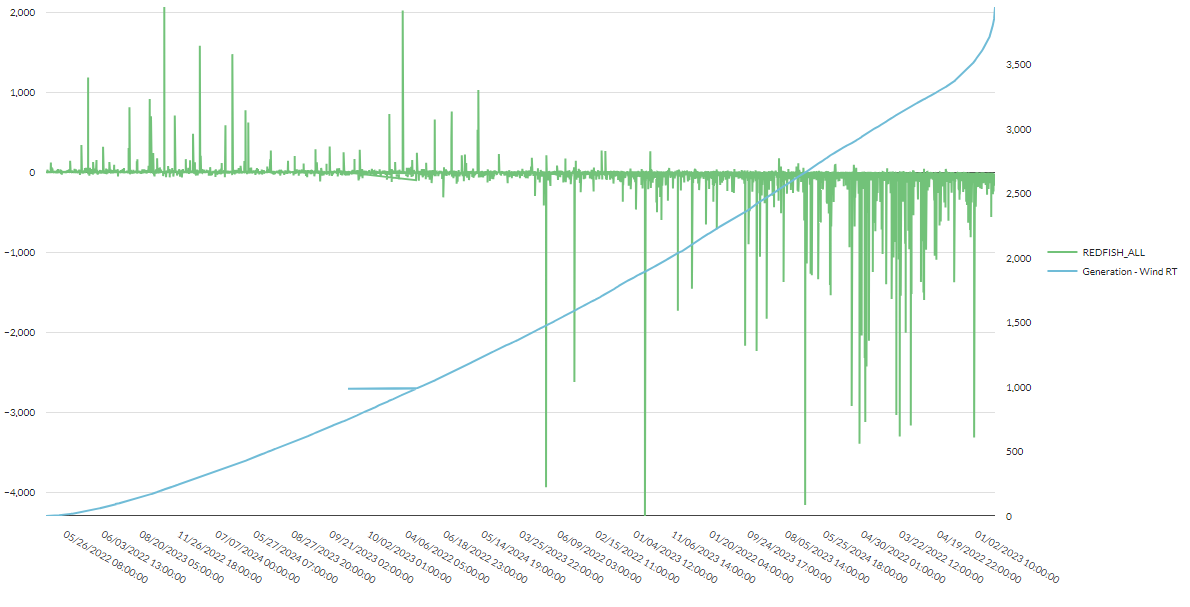
Source: Yes Energy, Site Pricing Profile Module
Bringing in ERCOT Interconnection Queue Data
Several factors might explain why production-weighted congestion between REDFISH_ALL and Hub South is less extreme this summer compared to the past two years. So far, ERCOT coastal wind generation, which is highly correlated with congestion at the REDFISH_ALL node, has been much lower this year (see chart below).
Average MWs of ERCOT Coastal Wind Generation, June/July 2022 to 2024

Source: Yes Energy, Time Series Analysis Module
We’ve used our Infrastructure Insights Dataset to identify additional factors. As you can see in the screenshot below, a large amount of battery storage and several 345kV transmission lines designed to respond to system capacity and load growth issues have come online since summer 2023. The transmission lines out of ERCOT South have impacted persistent negative congestion. The increase in price responsive energy storage resources have also likely served to smooth out negative pricing events.
Transmission and Generation Projects Online Between August 2023 and July 2024 in South Texas
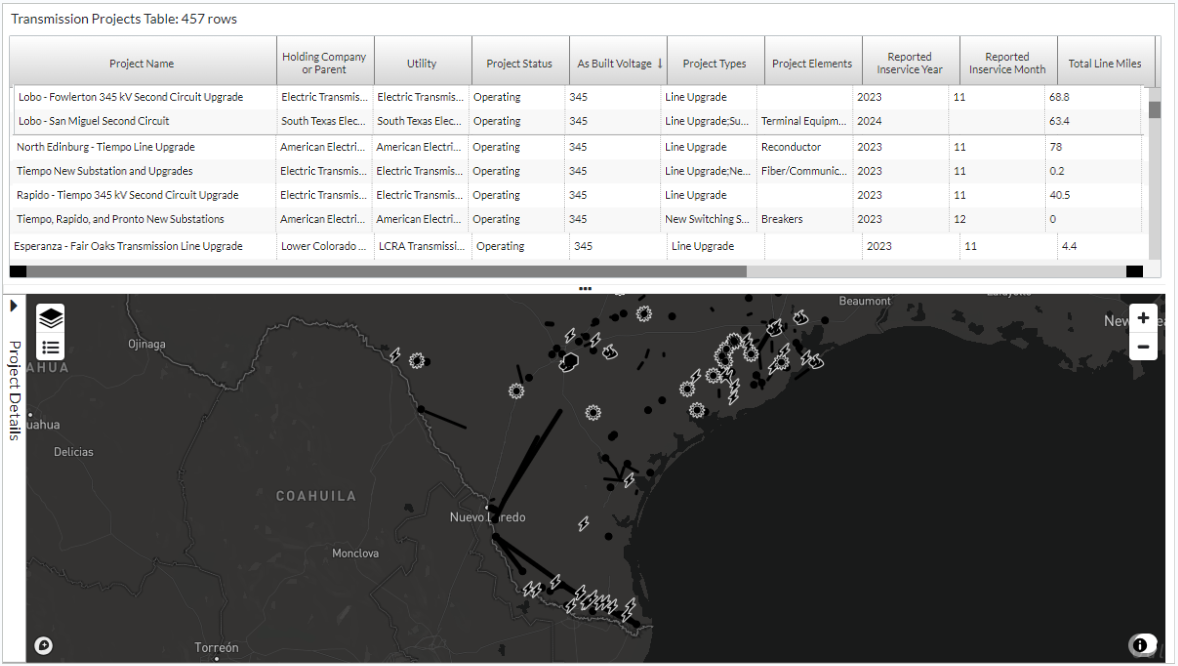
Source: Yes Energy, Infrastructure Insights Dataset
Improve Your Analysis
Understanding historical prices and the factors influencing those prices are critical to asset siting. By incorporating infrastructure projects into their analysis, asset developers can better understand upcoming changes to supply and demand that might impact asset revenue.
Reach out to learn how Yes Energy is helping companies navigate pricing, market fundamentals, and interconnection queue data to make better asset-siting decisions!
About the Author: Cliff Rose is a senior product manager at Yes Energy currently focused on building products that help power plant developers leverage wholesale power market data in their decision-making. He has 12 years of experience helping companies navigate power markets in both a consulting, and software development capacity. Outside of work, you can find Cliff engaging in stereotypical Colorado activities such as skiing, running, and biking.
