


Share this
by Clay Horning
Since its introduction by the California Independent System Operator (CAISO) in 2013, the duck curve has become emblematic of the challenges of balancing electricity supply and demand in regions with a high penetration of intermittent renewable generation.
Let’s explore the duck curve, how renewable energy curtailments are used to “flatten the duck,” and what all this means for you.
What Is the Duck Curve?
In the energy sector, the duck curve illustrates the difference between total electricity demand and the amount supplied by renewable sources, typically solar power. When the daily load curve is visualized, it resembles the silhouette of a duck, hence the name.
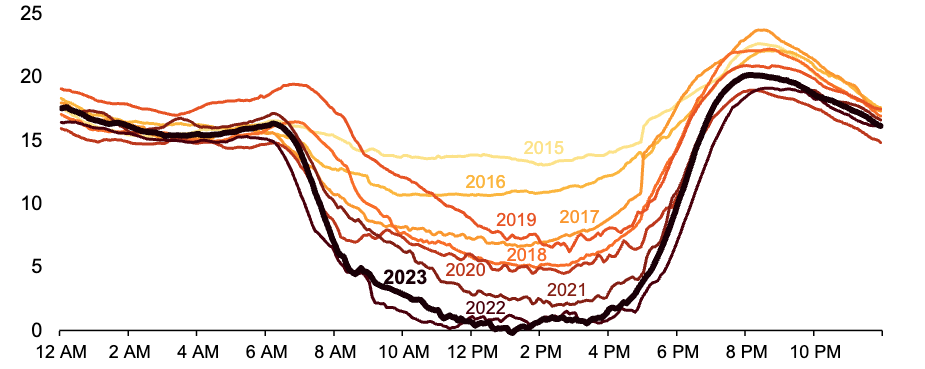
Source: US Energy Information Administration based on CAISO data. CAISO lowest net electric load day each spring (March-May, 2015-2023) gigawatts.
As you can see in the image above, during the morning hours (the tail of the duck), electricity demand rises as people start their day, but solar generation is still low. By midday (the "belly" of the duck), the net load (total demand minus renewables) drops steeply due to high solar generation. In the evening, solar generation drops as the sun sets, but electricity demand remains high (the "neck" of the duck), requiring a rapid ramp-up of other power sources.
In 2014, California had just 9 GW of solar and wind capacity online. By July 2023, that number had nearly doubled to 17.6 GW. You’ll notice in the image above that as more renewables have joined the grid, the belly of the duck has grown deeper.
This mismatch between when solar or wind power is generated and when it is needed can strain the grid and increase the risk of outages if it’s not managed properly.
That brings us to curtailments, one of the primary tools power systems use to ensure the power grid remains balanced.
The Grid’s Response: Curtailments
Curtailment is the intentional reduction of electricity generation or export to the grid by an Independent System Operator (ISO). A power generator may also reduce output in unfavorable market conditions. Any energy source can be curtailed, but intermittent renewable resources like wind and solar are most often constrained to balance and maintain the stability of the electric grid.
Generation resources are curtailed either because the grid is congested or supply exceeds demand.
Like a traffic jam, grid congestion occurs when the electricity flowing through a transmission line or piece of equipment exceeds its capacity. In other words, inadequate transmission can prevent renewable energy from reaching high-demand areas, triggering curtailments.
Oversupply happens when generation from intermittent resources like wind and solar is not aligned with demand patterns.
For example, solar production is highest during the midday when demand is low. Likewise, wind production typically peaks overnight or during shoulder seasons (spring or fall) when there’s less demand.
Types of Curtailments
Curtailments typically occur in one of two ways. Economic or market-based curtailments occur when generating electricity is no longer profitable because supply exceeds demand. Oversupply drives prices down, sometimes even into negative territory.
Reliability or grid-based curtailments protect the stability and safety of the power grid. When supply exceeds demand to the point that it threatens to overwhelm the grid’s capacity, equipment can fail, or rolling blackouts can ensue. To prevent this, grid operators may curtail supply to balance the grid.
Regulatory policies and contractual agreements may also limit the amount of renewable energy fed into the grid. In these cases, curtailment happens even though the grid’s infrastructure may be able to handle more power flow.
How Curtailments Flatten the Duck
The duck curve and curtailments are two sides of the same coin – the duck curve exposes timing mismatches between supply and demand, and curtailments are a mechanism to maintain grid balance.
In regions with high renewable penetration like California, curtailments act as a safety valve. The deep midday drop in net load (the “belly” of the duck) can push grid frequency and voltage outside operational limits if supply outpaces demand. Curtailments allow grid operators to avoid instability by reducing the amount of renewable energy flowing into the grid – essentially flattening the duck.
The duck curve is also a sign of a grid that lacks flexibility, and curtailments are one of the most direct consequences. Inflexible grids that can’t adapt to rapid changes in supply and demand often struggle to absorb excess power generation during midday, leading to curtailments.
As the sun sets and solar output drops sharply, the grid experiences the steep "neck" of the duck curve – a rapid increase in net load. Power grids need fast-responding, dispatchable resources like natural gas plants or battery storage to maintain stability during this ramp.
But when large amounts of solar are curtailed earlier in the day, there’s less surplus energy stored for later use, increasing dependence on fossil fuels and driving up both costs and emissions.
ERCOT and CAISO Curtailment Is on the Rise
In recent years, CAISO has curtailed in excess of 2 million MWh of utility-scale wind and solar output annually, as illustrated below.
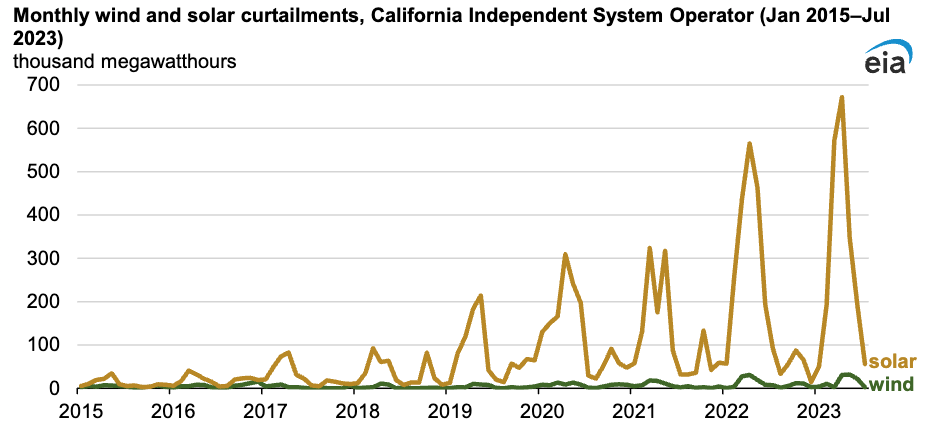
Source: US Energy Information Administration, based on CASIO data.
During just the first four months of 2025, CAISO curtailed more than 738,000 MWh.
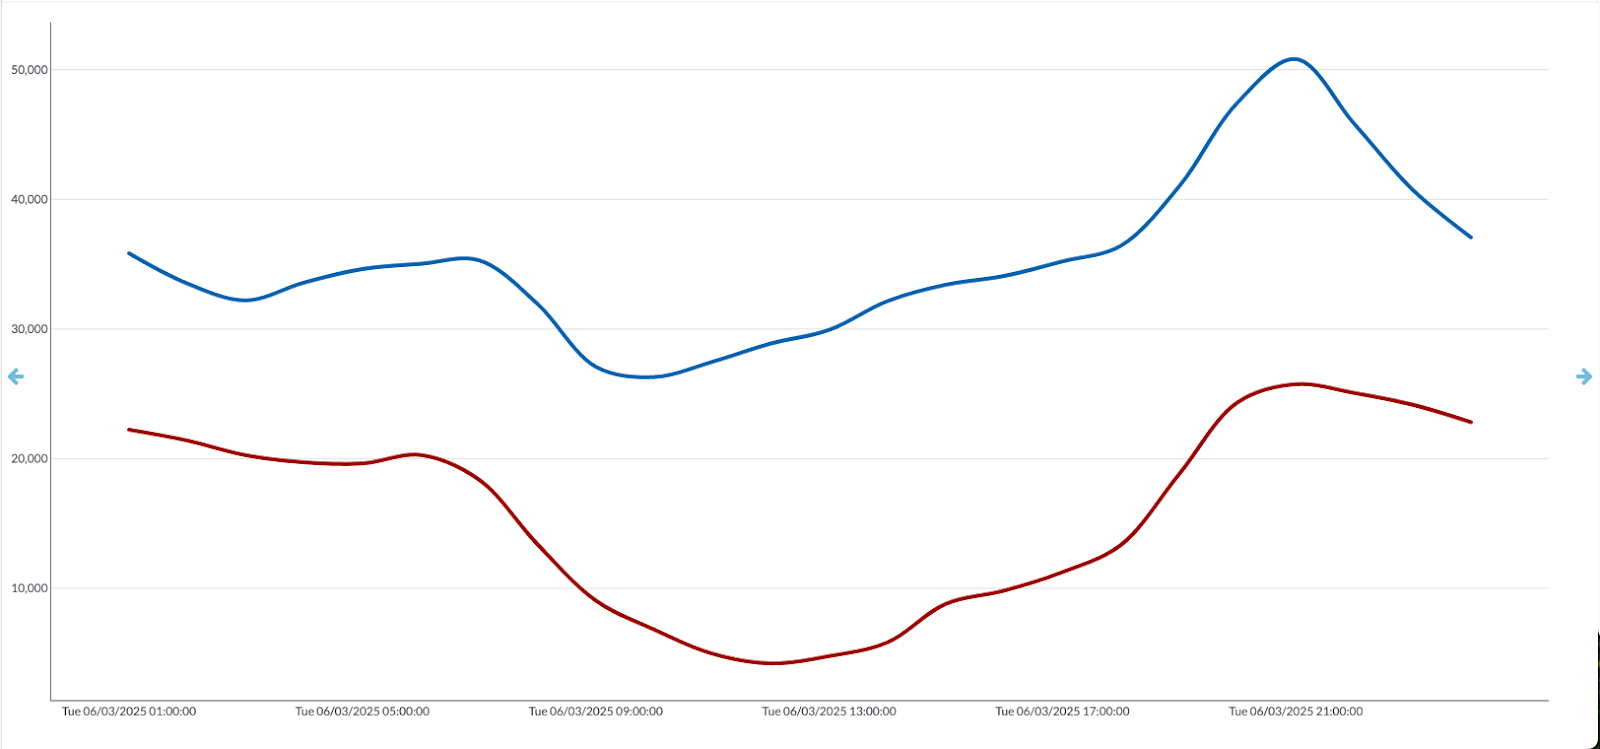
Curtailments are also on the rise in Texas, as wind and solar energy capacity have grown in recent years. Yes Energy’s Live Power shows such curtailments in real-time.
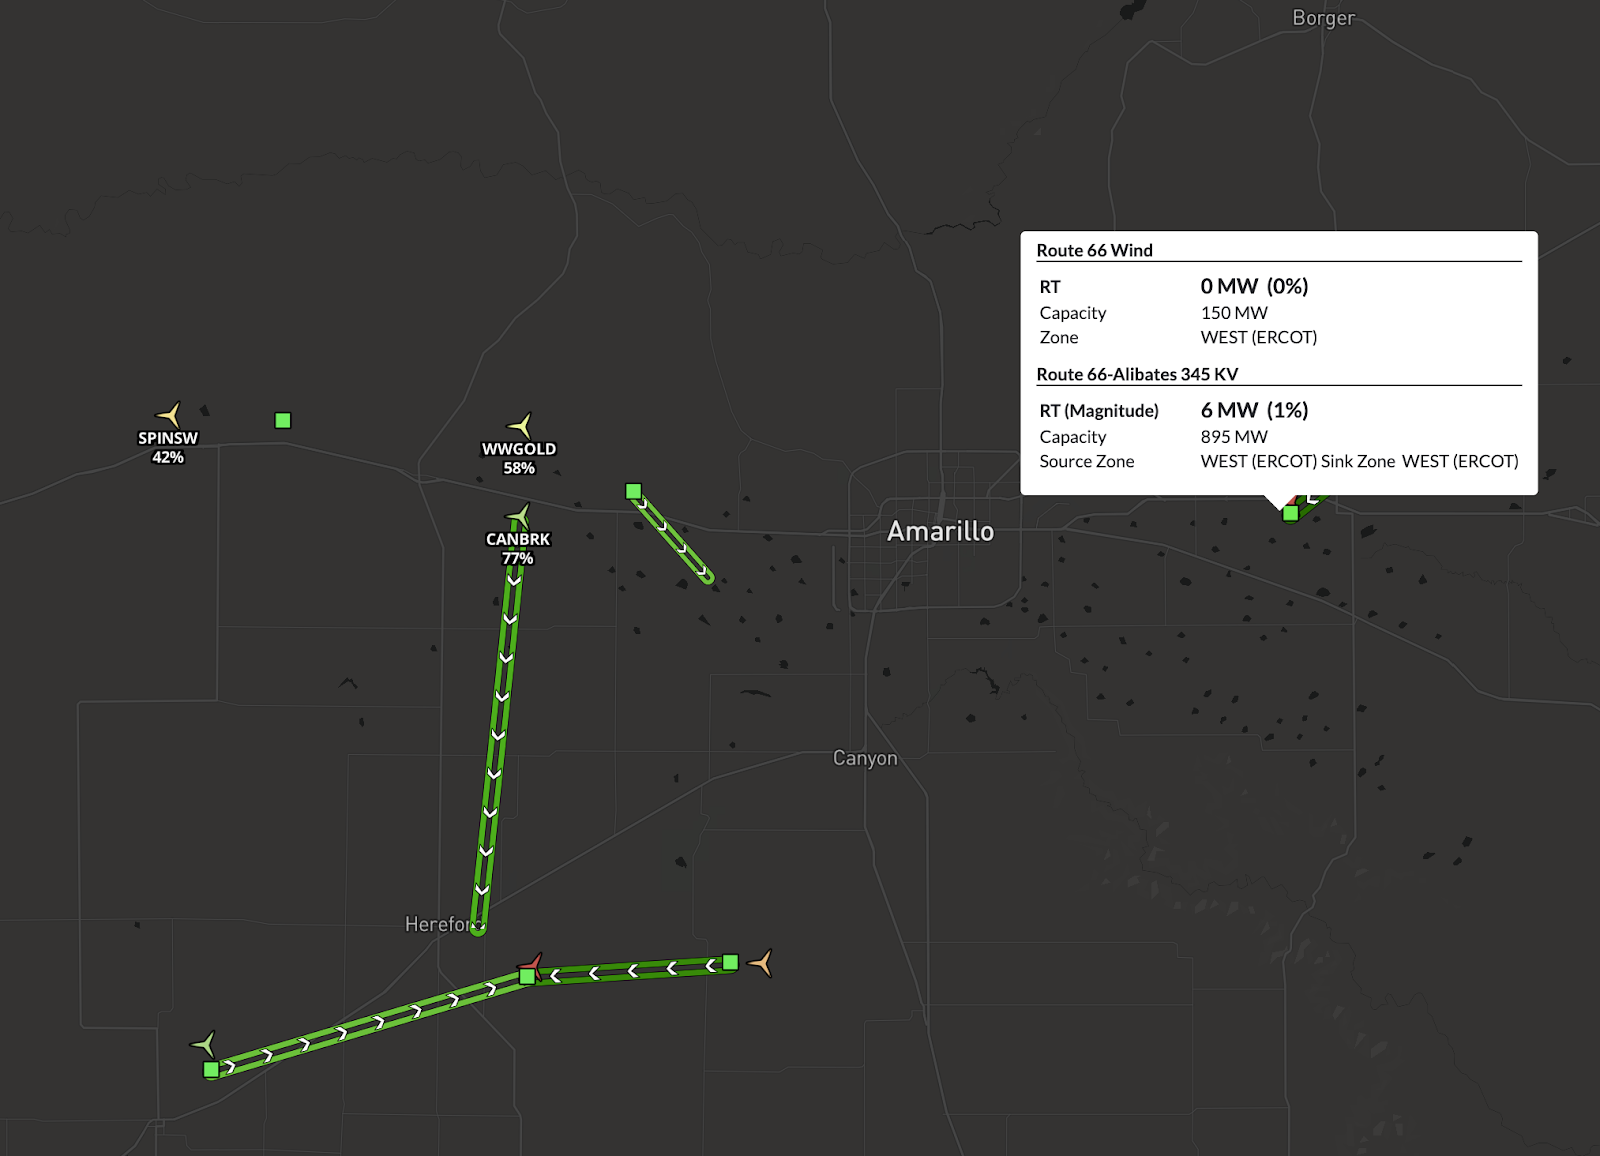
Source: Yes Energy Live Power®. ERCOT's Route 66 Wind node was fully curtailed (0% generation) on May 3, 2025.
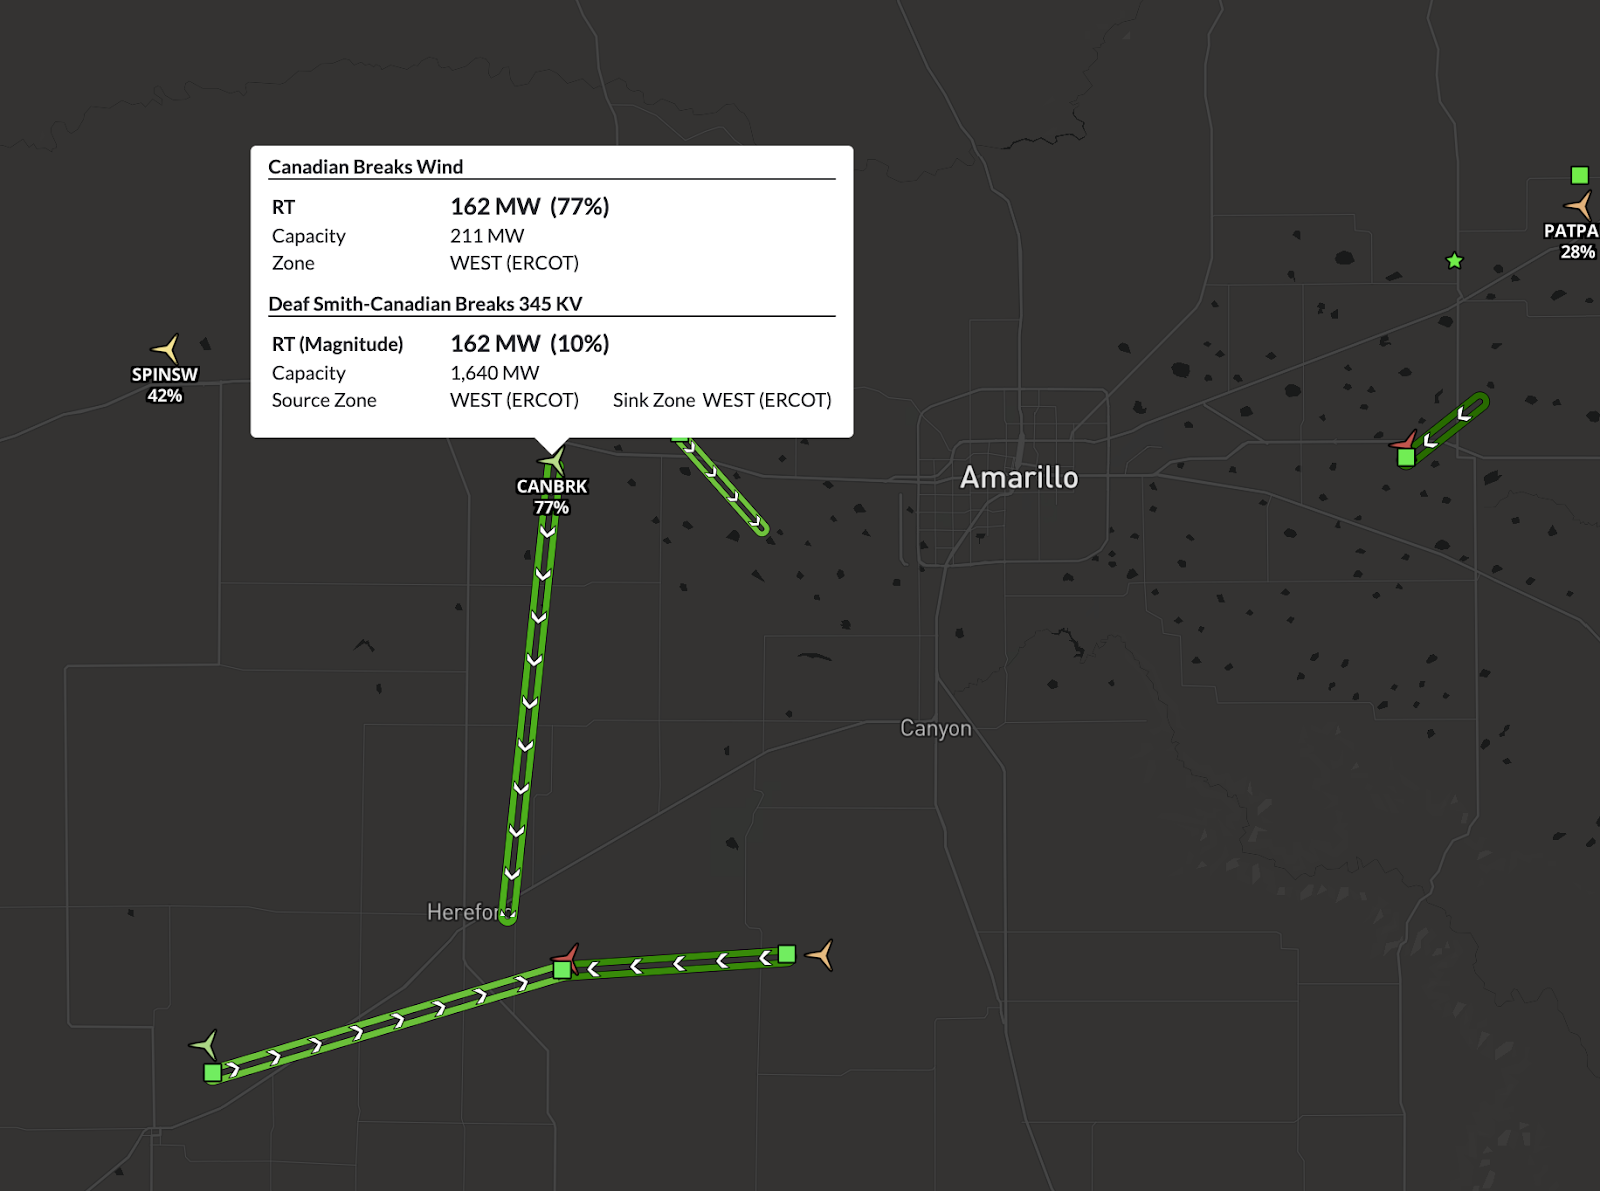
ERCOT's Canadian Breaks Wind node on May 3, 2025. Curtailment occurred because the two nodes are close in proximity, suggesting that wind speeds were similar. One of the plants was operating at 77% and the other was not operating at all. Source: Yes Energy Live Power®.
US Energy Information Administration data shows the duck curve becoming more pronounced in the Electric Reliability Council of Texas (ERCOT) region.
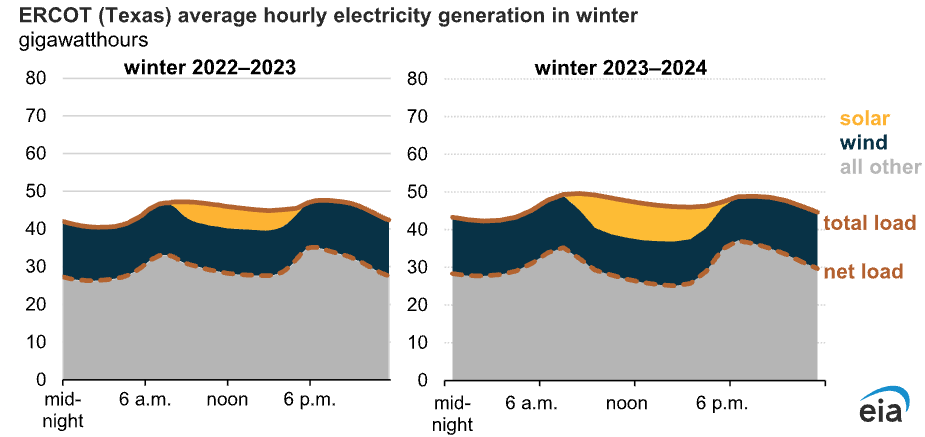
Source: US Energy Information Administration based on Hourly Electric Grid Monitor data. Note: Other fuels include coal, natural gas, hydropower, and nuclear. Utility-scale solar only. Winter is the full months of December, January, and February. ERCOT = Electric Reliability Council of Texas.
As shown below, ERCOT’s duck curve (blue) is comparable to CAISO’s (red) – driving the increasing need for curtailments to keep the Texas grid balanced.
Regardless of why or how curtailments are implemented, they can diminish returns on investment, discourage further clean energy development, waste clean energy, and lead to reliability concerns.
So how can market participants optimize their participation in markets prone to duck curves and curtailment?

Curtailment Reduction Strategies
As solar and wind penetration grows, grid operators and market participants face increasingly complex challenges related to the duck curve and renewable energy curtailments.
Addressing these challenges requires more than just infrastructure – it demands a strategic approach to market participation.
From siting decisions to bidding strategies, the ability to anticipate and respond to curtailment and ramping risks can make or break project economics. You have to understand market signals, price volatility, and grid constraints in context, and tools that provide real-time visibility and predictive insights are becoming essential.
Below are three key strategies for reducing curtailments:
- Increase Battery Storage Capacity
Grid expansion and investments in transmission infrastructure can help transport electricity from generation-rich areas to demand centers, reducing the need for curtailments. However, these projects are often costly and time-consuming.
On the other hand, batteries are relatively cheaper and faster to deploy, allowing them to play an increasingly important role in the grid. By absorbing excess solar energy during midday and discharging it during peak demand periods, batteries help smooth the duck curve and reduce curtailments. Deployment trends highlight significant growth:
- CAISO’s battery storage capacity growth has ballooned in the past five years, jumping from 500 MW in 2020 to more than 13 GW in early 2025. Batteries now represent a substantial share of the region’s dispatchable energy. By mid-2024, non-generating resource (NGR) batteries accounted for almost 12% of CAISO’s nameplate capacity.
- One of the country’s fastest-growing battery energy storage markets, ERCOT nearly doubled its battery capacity between 2023 and 2025. ERCOT’s battery storage capacity is now approaching 10 GW, and even more is in the pipeline.
- Encourage Demand Response Participation and Load Shifting
Utilities can encourage customers to adjust their energy use in response to supply conditions through various programs:
- Smart thermostats and EV charging enable automated responses to grid signals, shifting consumption to off-peak periods.
- Industrial demand response (DR) programs encourage industries to reduce or shift their energy usage during peak times in exchange for incentives.
- Time-of-use (TOU) rate designs price electricity higher during peak demand periods, encouraging consumers to use energy during off-peak times.
- Virtual power plants (VPPs) aggregate distributed energy resources (DERs) like rooftop solar and home batteries into a dispatchable resource that can provide flexibility to the grid.
- Use Advanced Forecasting and Dispatch Optimization Software
Integrating advanced tools into operational and strategic frameworks allow power market participants to navigate the complexities introduced by increasing renewable penetration, curtailments, and the duck curve:
- Renewable Asset Operators can utilize real-time monitoring and forecasting to adjust operations proactively, minimizing curtailments and optimizing revenue.
- Traders can leverage predictive analytics to inform bidding strategies, accounting for curtailment risks and price volatility associated with the duck curve.
- Utilities and Grid Operators can implement data-driven planning to enhance grid flexibility, integrate storage solutions, and design demand response programs that address curtailment and duck curve challenges.
.png?width=687&height=344&name=Untitled%20design%20(3).png)
Yes Energy offers a suite of tools to assist market participants.
- Live Power® delivers high-frequency, real-time data on generation output and transmission flows, offering granular visibility into grid conditions. This enables market participants to identify and respond to curtailment events as they occur. By comparing actual output against forecasts, Live Power can also indicate instances of curtailment, allowing for better model calibration and operational adjustments.
- PowerSignals® aggregates real-time and historical market data, transforming it into actionable insights through intuitive dashboards. Users can monitor locational marginal prices (LMPs), congestion patterns, and generation trends, facilitating the identification of curtailment risks and duck curve impacts. PowerSignals visualizes market dynamics so you can make informed decisions to mitigate curtailments and manage ramping challenges associated with the duck curve.
- EnCompass® provides robust zonal and nodal price forecasts, supporting strategic planning and investment decisions. By modeling future market scenarios, EnCompass helps stakeholders anticipate periods of potential curtailment and evaluate the economic viability of renewable projects. Forecasting tools enable the assessment of storage solutions and demand response strategies to address the steep ramps characteristic of the duck curve.
- GridSite® offers insights into historical market pricing, transmission constraints, and interconnection queue data, aiding in optimal asset placement. By analyzing congestion and pricing trends, developers can site assets in locations that are less prone to curtailments. Understanding regional load profiles and solar generation patterns assists in designing projects that align with demand curves, reducing duck curve impacts.
Conclusion
The duck curve and rising curtailments are challenges – but they also signal progress toward a cleaner grid. With the right tools and strategies, you can turn these challenges into opportunities, optimizing operations and supporting a more flexible, resilient energy system.

About the author: Clay Horning is an associate product manager at Yes Energy, focused on building products that deliver real-time power market data to support critical trading and operational decisions. He has a background in software development and enjoys creating tools that turn messy data into something clear and actionable. Outside of work, he likes hiking, biking, and playing chess.
