


Share this
Successful power traders need to stay ahead of countless market factors such as weather forecasts, regulations, and grid conditions when buying and selling electricity to leverage price changes and balance supply and demand. Real-time energy data and alerts from Independent System Operators (ISOs) such as prices, constraints, load curves, outages, and weather serve as critical volatility indicators when operating in the real-time market.
The intricacies of power market data, available from myriad sources and presented in diverse formats, pose significant challenges to informed decision-making. The fragmented nature of this data further complicates matters, making it inherently challenging to compare relevant information across different markets and even between various data portals within the same ISO.
QuickSignals® resolves these issues by offering enhanced data accessibility from each ISO and standardizing it within a user-friendly platform, which enables faster and more informed decisions. When each minute and second counts in translating market noise into actionable insights, having reliable tools at your disposal is essential.
Stay Ahead of the Market with Real-Time Energy Data, Market Monitoring and Alerting
QuickSignals’ low-latency data enables power traders to visualize changes in the market using easy-to-use dashboards. Instead of spending their time decoding data, traders can now stay on top of market opportunities as they materialize in real time.
If you’re a power trader dispatching a plant, for example, QuickSignals allows you to create custom calculations to help make sense of the data in more meaningful ways. It also allows you to get live updates and alerts of all of the valuable ISO market data such as prices, constraints, live load curves, outages, weather, volatility indicators, and time-series graphs.
And since QuickSignals is integrated with our PowerSignals® solution, it makes it easy to drill down from a single tick in your QuickSignals dashboard to the robust history and analytics available in PowerSignals.
In the examples below, we’ll walk you through several sample workflows.
ERCOT Generation Resources
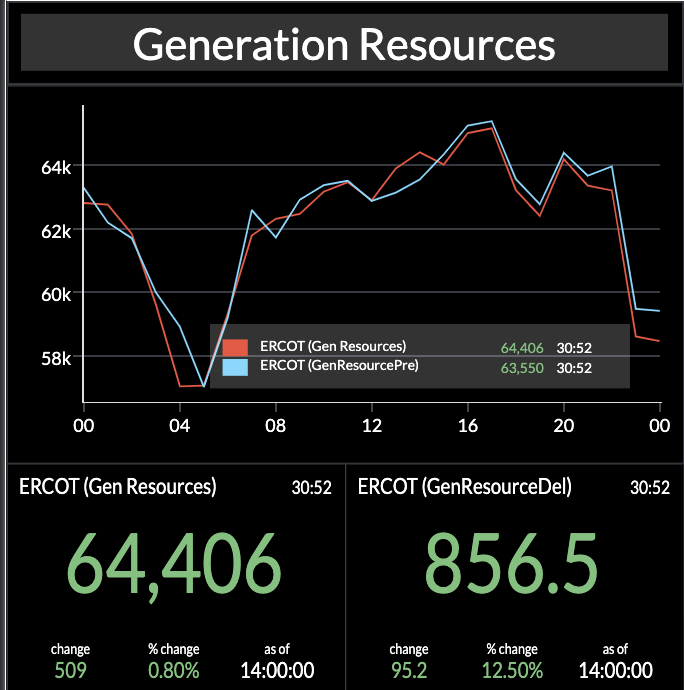
ERCOT provides ISO-wide generation capacity data in its Short-Term Adequacy Report, detailing the total capacity available to the grid operator for real-time dispatch. For traders utilizing QuickSignals, this information becomes even more actionable. By crafting custom formulas within the dashboard, traders can intuitively pinpoint changes in generation resource values between intervals.
This data gains significance when trends emerge between consecutive intervals. For example, a discernible increase in the delta between the current and previous values signifies a reduced megawatt reserve within the ISO's operational framework, which may be indicative of impending price volatility. The chart below juxtaposes the current generation resource value with the previous interval.
You can continue this analysis with further layers of insight, such as determining ancillary service capabilities. Unlimited dashboards allow you to create and share information quickly and easily, while our customizable display and data options enable you to display the ISO data most relevant to you.
ERCOT High Ancillary Service Limit (HASL)
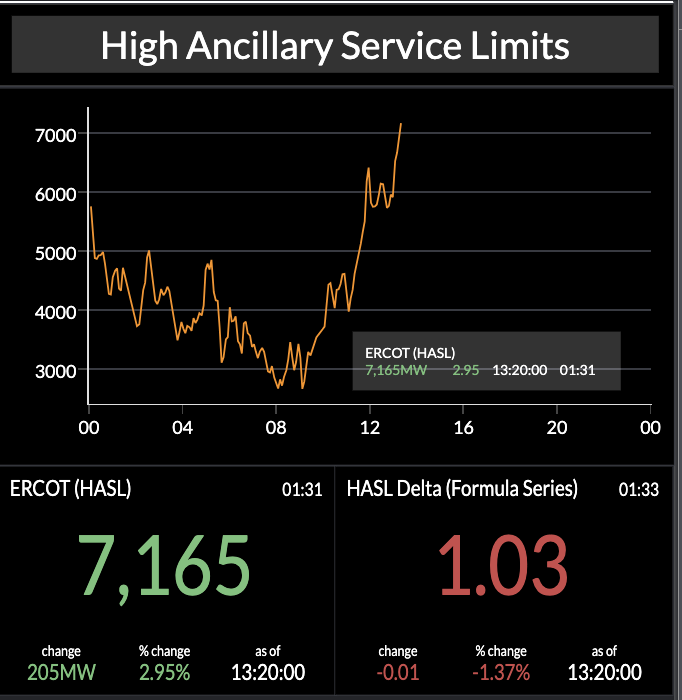
The High Ancillary Service Limit is a key metric for understanding ERCOT’s real-time ancillary services market. This data represents the sum of all megawatts available to the ISO for regulation up, including response reserve service (RRS) and non-spin reserves. Because price adders begin to factor into the calculation of LMP in the face of reserve shortages, HASL values can help to decipher movements in the operational reserve demand curve (ORDC).
PJM Contingency Reserves
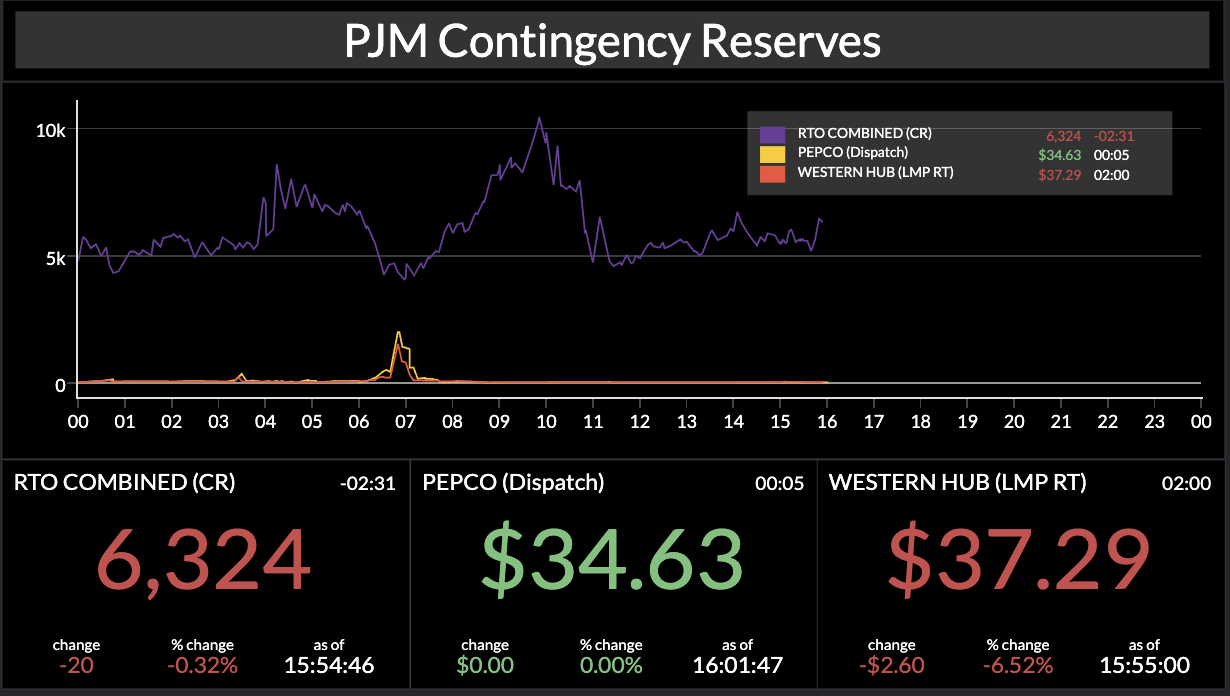
Contingency Reserves represent the total capacity of generation reserves that can respond within 10 minutes from Pennsylvania-New Jersey-Maryland Interconnection’s (PJM) request to run. Reserve shortages will result in price increases and can serve as a good indicator of price volatility.
To illustrate the relevance of this data, the chart below shows a dip in Contingency Reserves and a correlated spike in dispatch rates and LMP.
Live Power Real-Time Generation
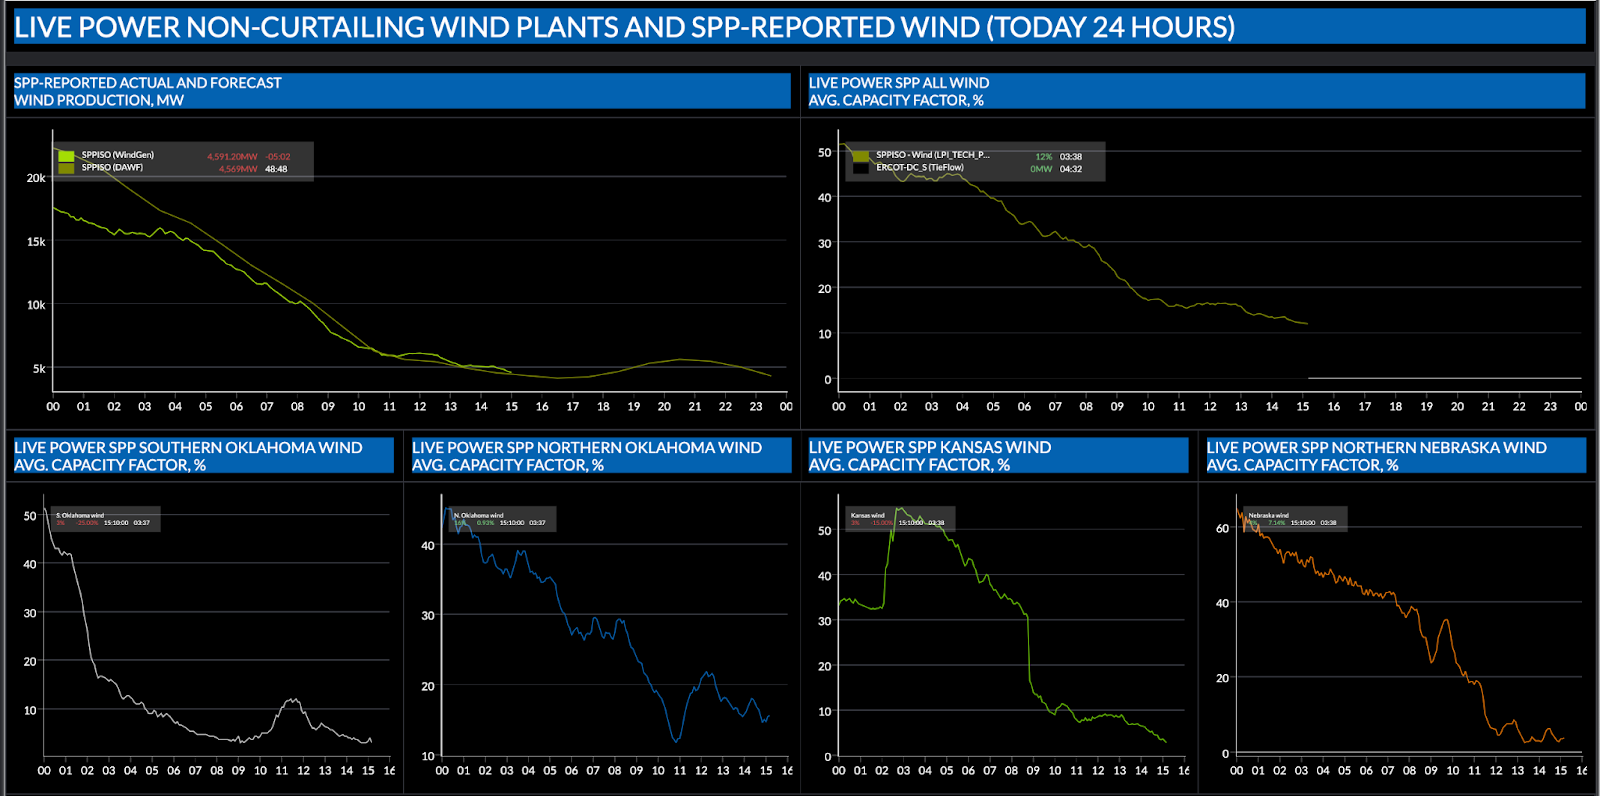
Live Power® delivers high-accuracy, real-time generation and transmission flow data every 60 seconds, supporting first-mover advantage. Custom alerts allow you to keep up with critical events.
In the chart below, we’re viewing the real-time capacity factors of various wind farms in Southwest Power Pool (SPP). All of the plants’ capacity factors are trending down, which indicates that the ISO will need to start turning on dispatchable resources which will drive market prices up.
QuickSignals allows for the intuitive digestion of many data pieces at once so that you can translate market noise into timely, actionable, and customizable insight.
How Yes Energy Can Help You Win the Day Ahead™
QuickSignals allows you to configure custom dashboards, highlighting data points you need to make power trading and asset dispatch decisions more quickly and accurately. Request a demo to see how QuickSignals enables you to see real-time energy data and stay on top of market opportunities.
