


Share this
by Yes Energy
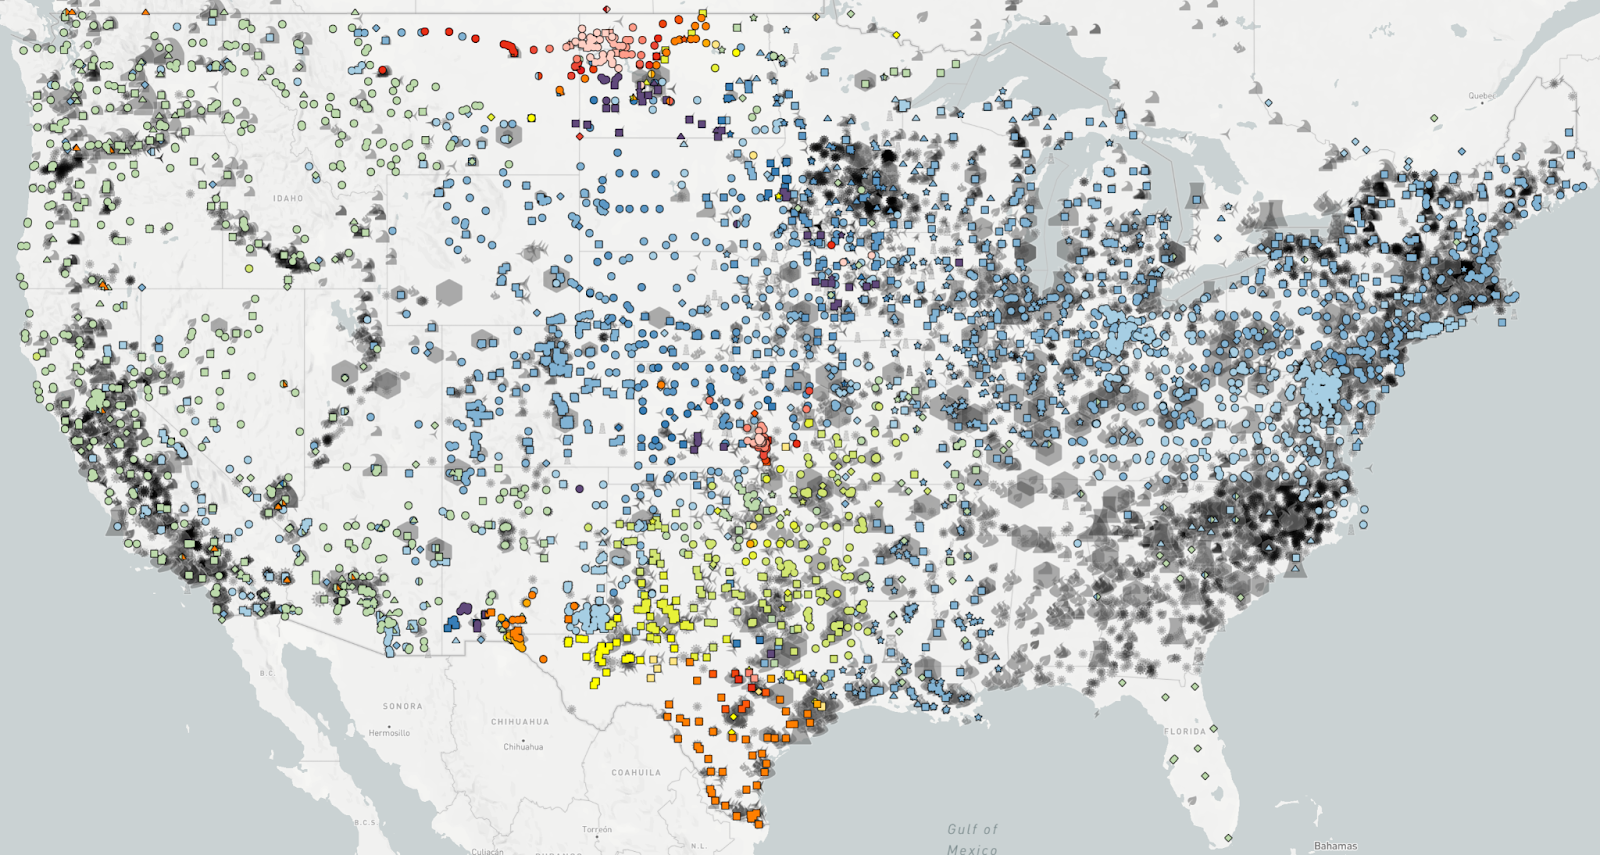
How many generators exist today on the US electrical grid? How many more will be added as the renewable transition continues? To date, Yes Energy® has mapped over 13,250 generating facilities and counting (available via the user interface or data solutions).
Yes Energy customers have long enjoyed the ability to understand and anticipate market events based on the underlying market fundamentals visualized in our mapping functionality. We heard your desire to extend that capability onto your own platforms, and now you can with Yes Energy Power Market Geo Data.
When discussing geo-referenced objects (plants, LMP nodes, weather stations), the other power comes in the form of object relationships. Typically, the lat/long data is not utilized in a vacuum. Accessing the associated data in addition to geo-references is key to powerful analysis. Some of those relationships can come in the form of accurate historical price node information associated with a generator or load, historic and real-time generation data tied to a specific plant, relating generators to EIA codes, etc. Having a singular hub for all the data used in a thorough analysis is our goal with the addition of our Power Market Geo Dataset.
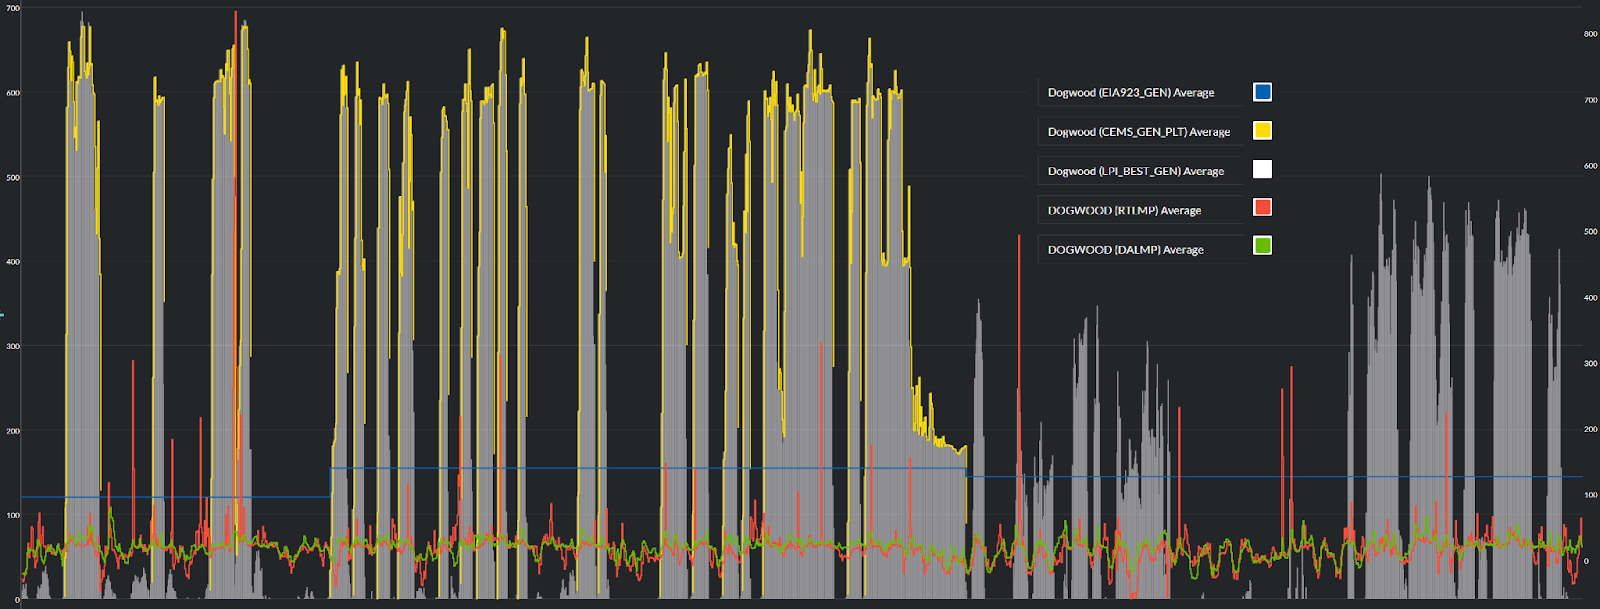
The example below is the result of a single-point connection. You can easily research EIA, CEMS, Live Power-monitored generation data, and nodal LMPs for the Dogwood Energy Facility in Pleasant Hill, MO, (EIA plant code 55178, 38°47'35.2"N 94°18'02.2"W, Pnode - DOGWOOD).
Are you examining geography-based risk? Looking for a new view for generation site analysis? Utilizing an advanced GIS platform in need of power market data? Something else? Tell us how our Power Market Geo Dataset can help support your business!

