


Share this
Power load forecasting can be as simple as correlating demand with temperature or as sophisticated as AI or machine-learning ensembles. Each approach has pros and cons, but they all risk missing the deeper drivers of power demand volatility.
At Yes Energy, we rely on a time-varying coefficient regression model. It captures not only the obvious temperature signal but also the harder-to-see effects – humidity, overnight cooling, building thermal mass, and more – that pure “temperature-onlyˮ or “last-yearˮ models often overlook.
Let’s see it in action.
June 2025 delivered record-breaking heat across Japan. The time frame provides a perfect case study to show where different models shine – or stumble.
Why Temperature-Only Models Come Up Short
A model that maps temperature (or any single weather input) to power demand will struggle to explain complex weather swings like those we just experienced.
When operators canʼt “seeˮ why the predictions changed, confidence drops and the quality of decision-making suffers.
Case Study: Tokyo, Summer 2025, Mid-June (Observed) vs. Early July (Predicted)
The table below compares three-day periods built from observed June data and projected July data for Tokyo. “Average Daytime Tempˮ is the mean from 10:00 to 16:00.
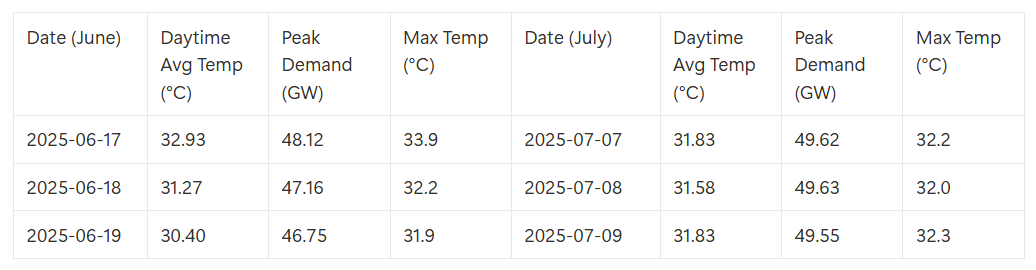
Source: Yes Energy
July demand is predicted to be ≥ 1.5 GW higher, even though June was hotter. A simple temperature-to-demand curve canʼt explain the gap.
Whatʼs Driving the Power Forecasts’ Difference?
- Humidity packs a bigger punch than you think. For peak hours in July, humidity is projected to run 6 to 9 percentage points higher than in June.
Higher humidity:
- Raises perceived temperature
- Extends AC run times and duty cycles
- Pushes total load upward.
- Thermal lag and the cooling feedback loop contribute. Consecutive hot and humid days in early July mean nights donʼt cool off, and buildings start the day already warm. AC units ramp early and hard, and efficiency falls as humidity rises.
In June, cooler nights allowed structures to shed heat, keeping the next-day load lower.
Visual Evidence: Demand vs. Weather Overlays
Temperature and Demand
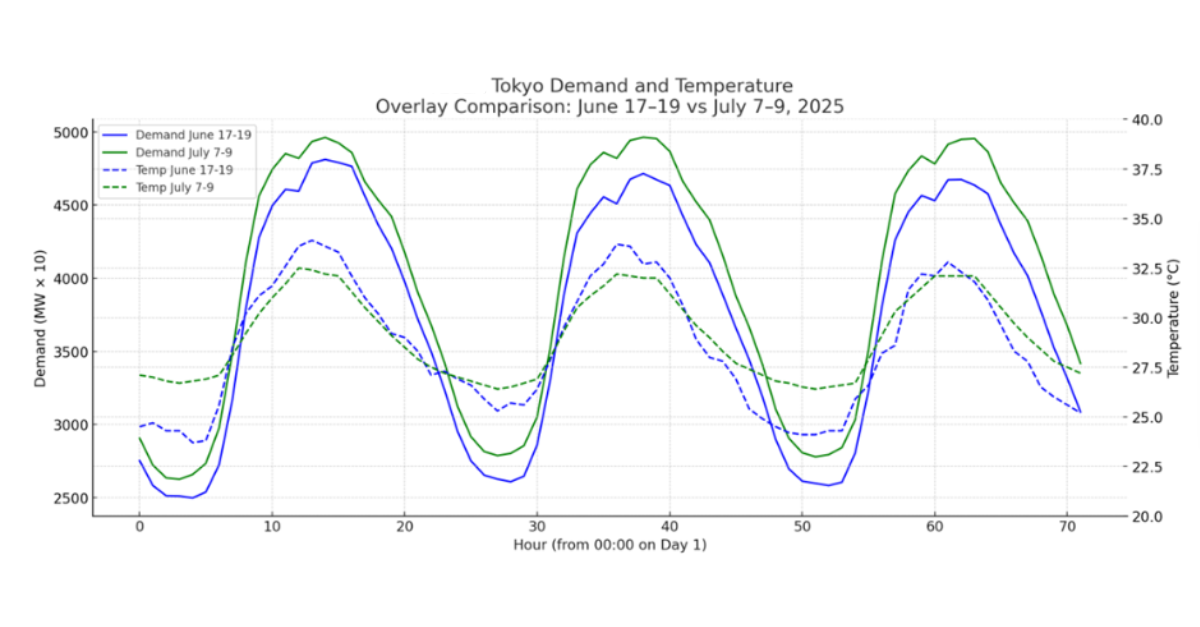
Source: Yes Energy Demand Forecasts
Blue represents June (actual). We see higher temperatures, but lower demand. Green represents July (projected). We predict slightly lower temperatures but higher demand.
Humidity and Demand 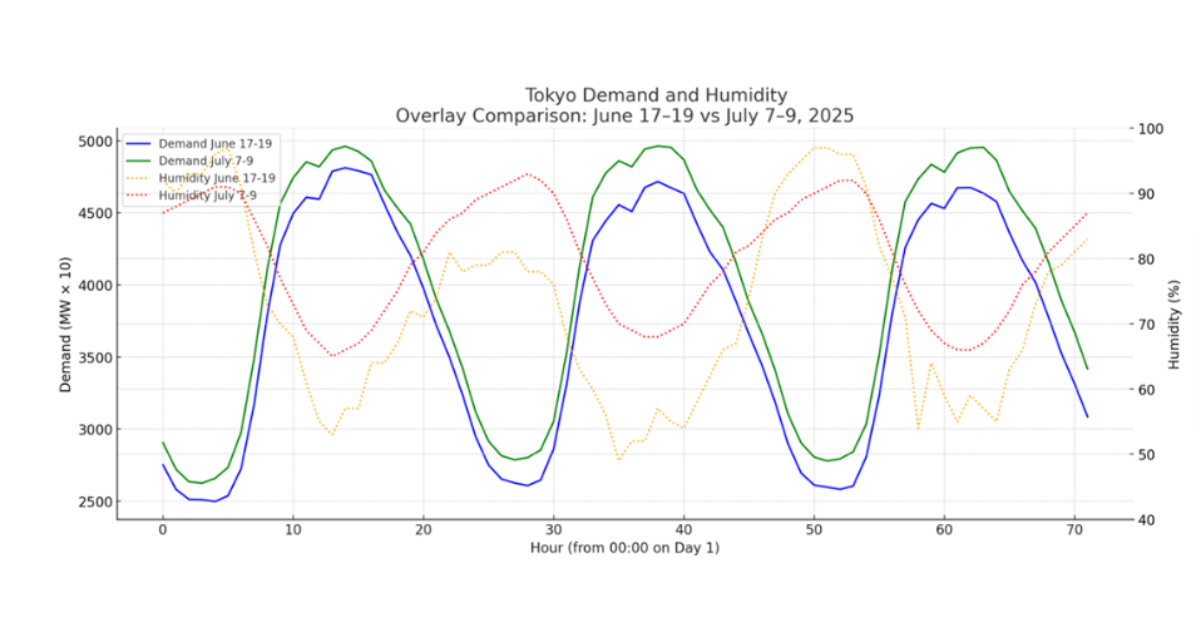
Source: Yes Energy Demand Forecasts
Orange represents June with 55 to 61% humidity. Red represents July with 62 to 65% humidity. Higher humidity correlates with increased demand.
About the Simulation Forecast
Forecast: Baseline demand used the official humidity outlook (see charts above).
Simulation: Demand recalculated with humidity 6% lower on July 8.
Difference: The direct impact of humidity change (lag effects excluded).
Even a small relative humidity tweak can shift peak load by a full gigawatt – proof that multi-factor models beat “temperature-onlyˮ models every time.
We also ran a what-if simulation: What if July 8 humidity dropped by the same 6%?
The result: nearly 1 GW lower peak demand, which confirms humidityʼs outsized role. A 1.52 GW swing can move market prices dramatically.
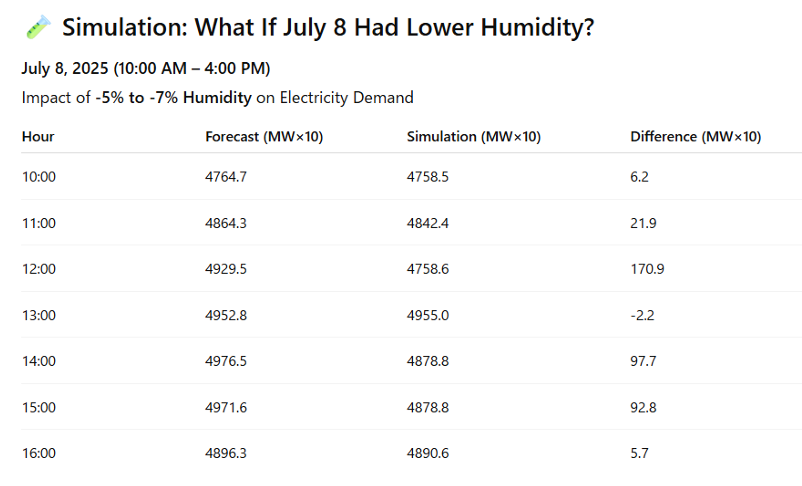
Source: Yes Energy
What Makes the Yes Energy Model Different?
For APAC, North America, and Europe, our Yes Energy model:
- Integrates temperature, humidity, overnight cooling loss, and more
- Accounts for short-term lag effects between weather shifts and load
- Provides transparent visuals so you can see why the projection moves.
During the summer peak, you need power load forecasts that mirror reality – not just the thermometer. Our team also answers your questions, and unlike with AI power forecasting models, we can explain the “why” behind the forecast, giving you increased confidence.
Talk to our team to see our power load forecasting in action.

About the author: Tetsuya Totsuka is an APAC power-market expert covering Japan, Australia, and New Zealand, specialising in electricity-demand forecasting and statistical modelling. With more than a decade of technical-sales and consulting experience, he turns wholesale-market complexity into clear, actionable strategy for Yes Energy’s clients through data-driven insights.
