


Share this
The Wind Production Tax Credit and Its Impact
The Wind Production Tax Credit (PTC) is available to utility-scale wind projects and provides a tax credit of $10-20 per MWh of production for the first 10 years of operation. This makes the marginal cost of production for eligible projects fall below $0/MWh. For example, if a wind project receives a tax credit of $19/MWh, the project will produce when prices at its local node are above $(19)/MWh.
After 10 years of production, projects are no longer eligible for the PTC (some projects are repowered to gain additional years of PTC eligibility, but this requires significant equipment upgrades and that at least 80% of the facility property value is new). This raises the marginal cost of production to $0/MWh – which means that these projects will now have negative margins at negative prices.
Once a project has phased out of PTC eligibility, its output is likely to be economically curtailed when its real-time settlement price is $0/MWh or negative. Economic curtailment occurs when negative nodal prices cause wind producers to reduce output to zero in an effort to avoid losses. This is in contrast with congestion-related curtailment, which occurs when power cannot flow due to line capacity limitations. Knowing which projects will curtail, and when, can be extremely useful for modeling price formation and power flows.
Live Power Provides One-Minute Wind Production Data for PTC-Ineligible Plants
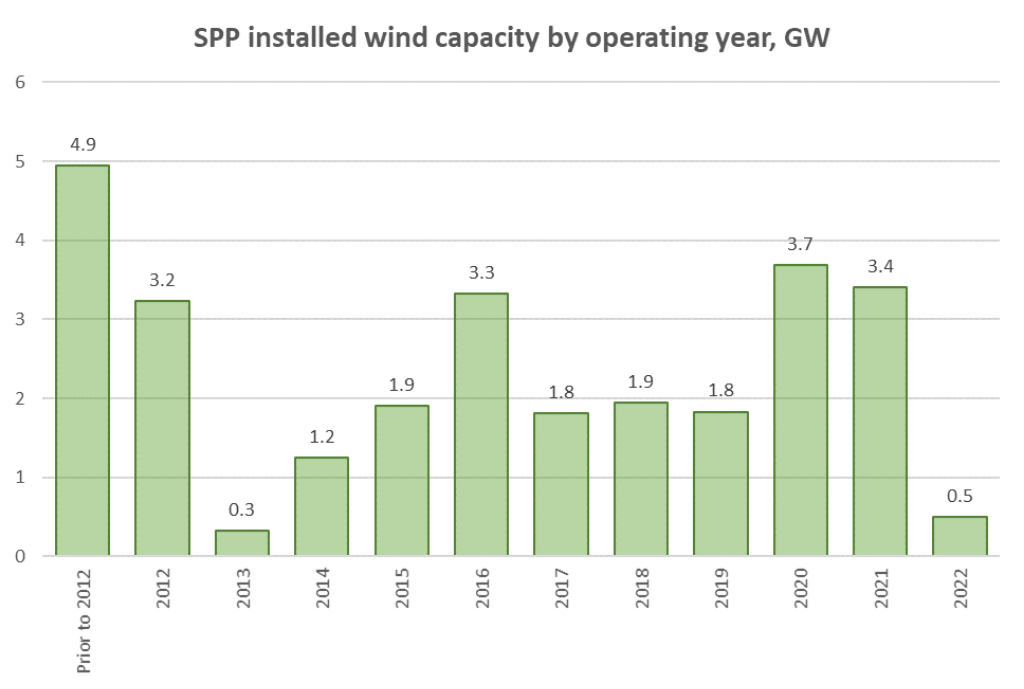
In wind-heavy markets such as the Southwest Power Pool (SPP), large amounts of wind production can push nodal prices to $0/MWh or below, resulting in economic curtailment of wind output for projects without PTC eligibility and facing negative margins. As of January 2022, there was 28.1 GW of installed wind capacity in SPP (EIA860 Monthly, January 2022). Ignoring any potential repowering, 3.2 GW of wind capacity will become ineligible for the wind PTC this year, with another 1.5 GW losing eligibility in 2023-24.
Live Power provides the most up-to-date production data for 42 wind projects in SPP comprising 12.5 GW of capacity, with coverage growing daily. 1,780 MW of SPP wind covered by Live Power was built prior to or during early 2012 and can be monitored for curtailment when prices are at or below $0/MWh.
Contact sales@yesenergy.com for a list of SPP wind projects covered by Live Power.
Using Live Power Data to Track Economic Wind Curtailment
One of the simplest ways to monitor curtailment at low prices is to use time-series data to plot the output of a given wind project against the prices at its node. Below is a time series chart with the output for the Taloga wind project (130 MW, built in July of 2011) in blue overlaid with the real-time prices at its node (OKGETALOGAWIND) in green. The time series shows that when nodal prices (green line) are negative, Taloga Wind production (blue line) drops to zero MW. 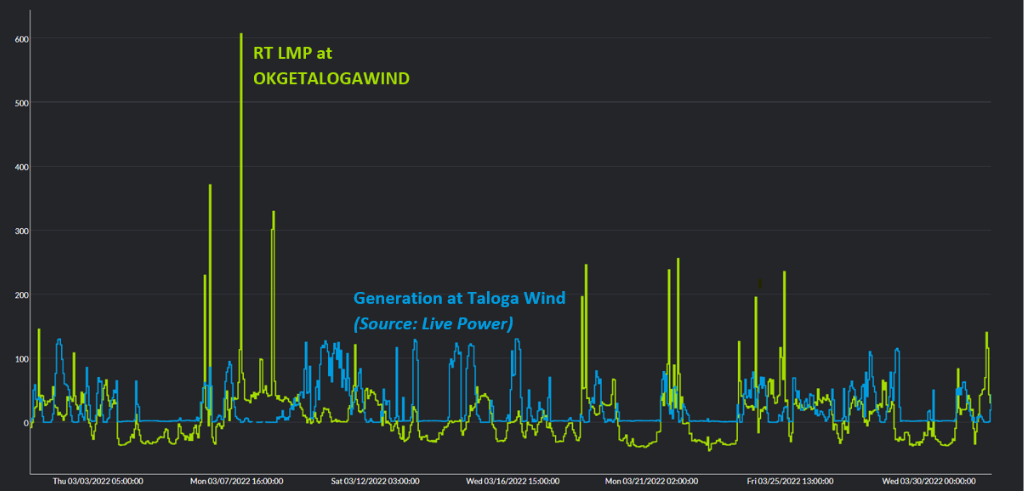
This relationship can also be displayed using the scatter plot below, where the generation at Taloga Wind is on the x-axis and the real-time LMP at the Taloga Wind price node is on the y-axis.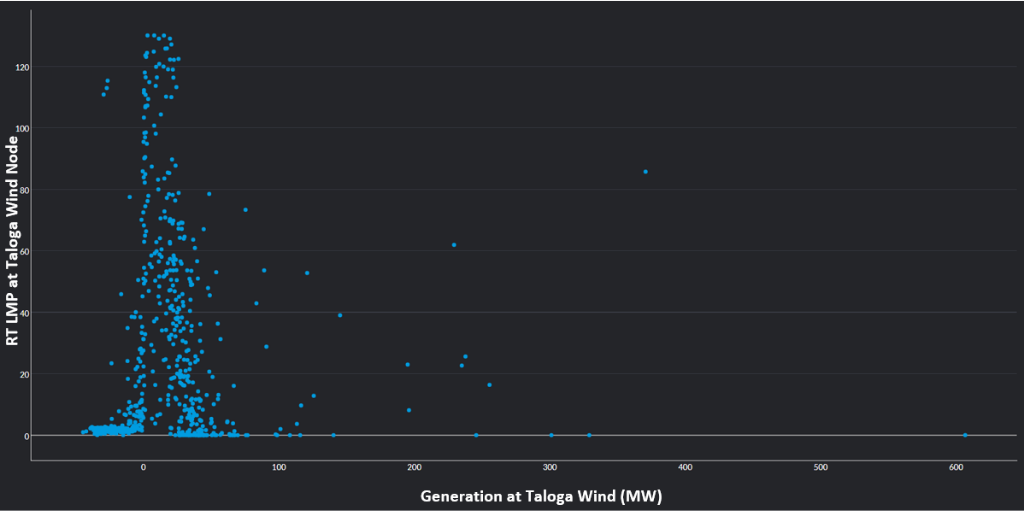
By using time series data to create scatter plots for different periods, you can identify the time frame in which curtailment is likely to have started. For example, the scatter plots below show output from the Crossroads Wind (228 MW, built in January 2012) across different time periods between November 2021 and February 2022; these series were exported to Excel directly from Yes Energy’s time series module in PowerSignals and then plotted together. There is a clear break in the relationship between output and prices between the end of 2021 and February 2022, with Crossroads Wind appearing to have lost PTC eligibility sometime in January 2022. This makes sense given its in-service date of January 2012.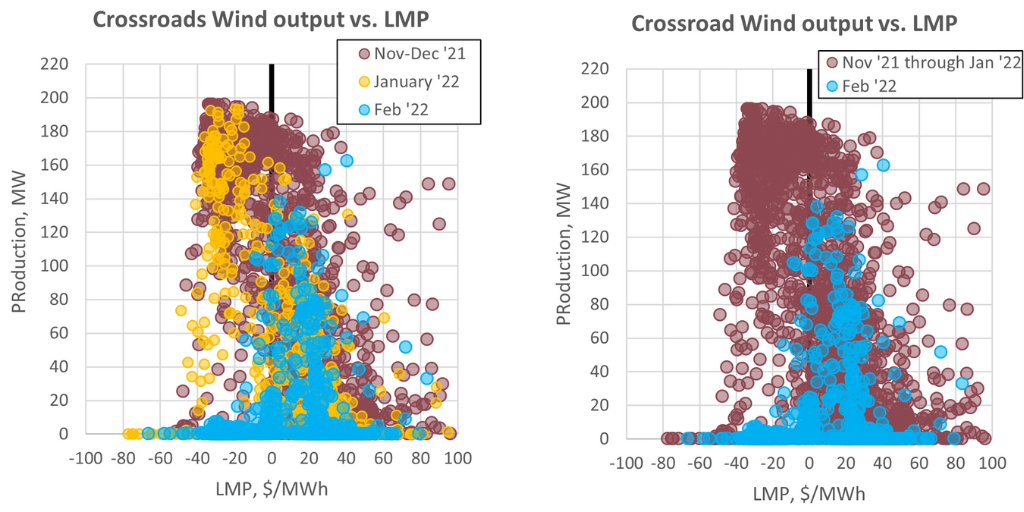
Once a project has been identified as likely to curtail when prices are below $0/MWh, our low-latency dashboarding product QuickSignals can track wind production vs. price in real-time. Below are QuickSignals widgets with time series and tabular data for both Crossroads and Taloga wind. 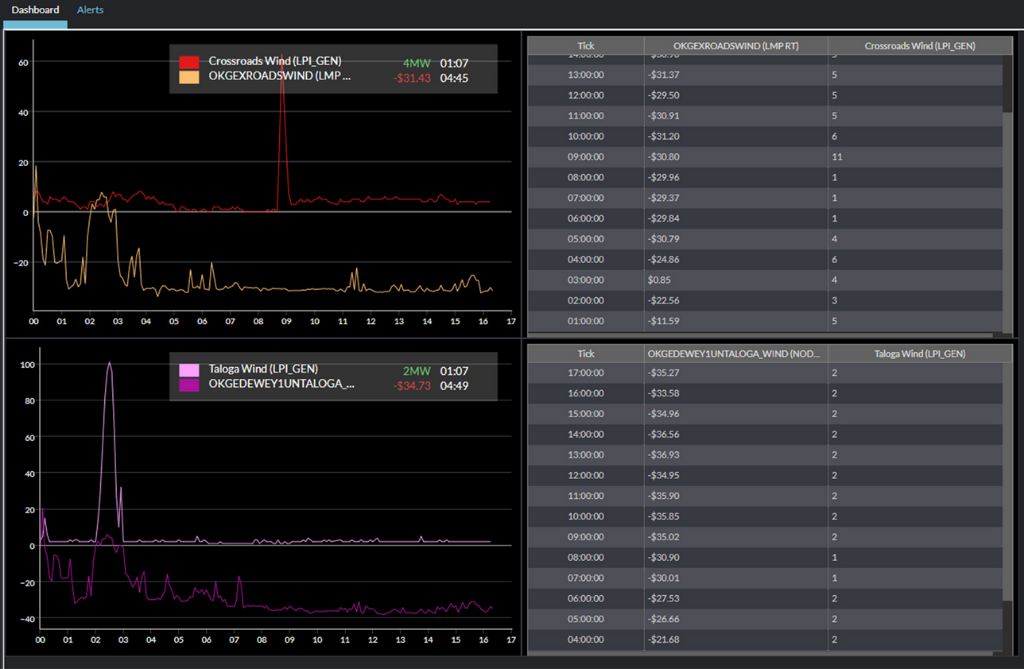
QuickSignals also includes powerful alerting capabilities, such as setting up alerts so that a user is notified when a project begins to curtail. Multicondition alerts for the Crossroads Wind facility can be set up so that you are notified in the QuickSignals dashboard, over text, and over email. It would be feasible to set up a QuickSignals dashboard and alerts that tracked all wind projects in an ISO likely to experience economic curtailment.
Live Power’s generation production data can support the fastest model calibration and reflects the most up-to-date system conditions. Yes Energy’s comprehensive real-time ISO, weather, FERC, and fuel data complement Live Power series. Together, they can give you the tools to most accurately model and analyze supply trends.

