


Share this
by Jake Landis, Stephanie Staska, and Paul Pontenagel on Sep 27, 2024
Whether you’ve never conducted transactions in power markets or you’ve traded in other international organized power markets and want to see how to trade in the US, we have you covered.
We’ll dive into why you’d want to trade in US power markets, the differences between European and US power markets, and how to enter US power markets quickly.
Why Are US Power Markets Attractive?
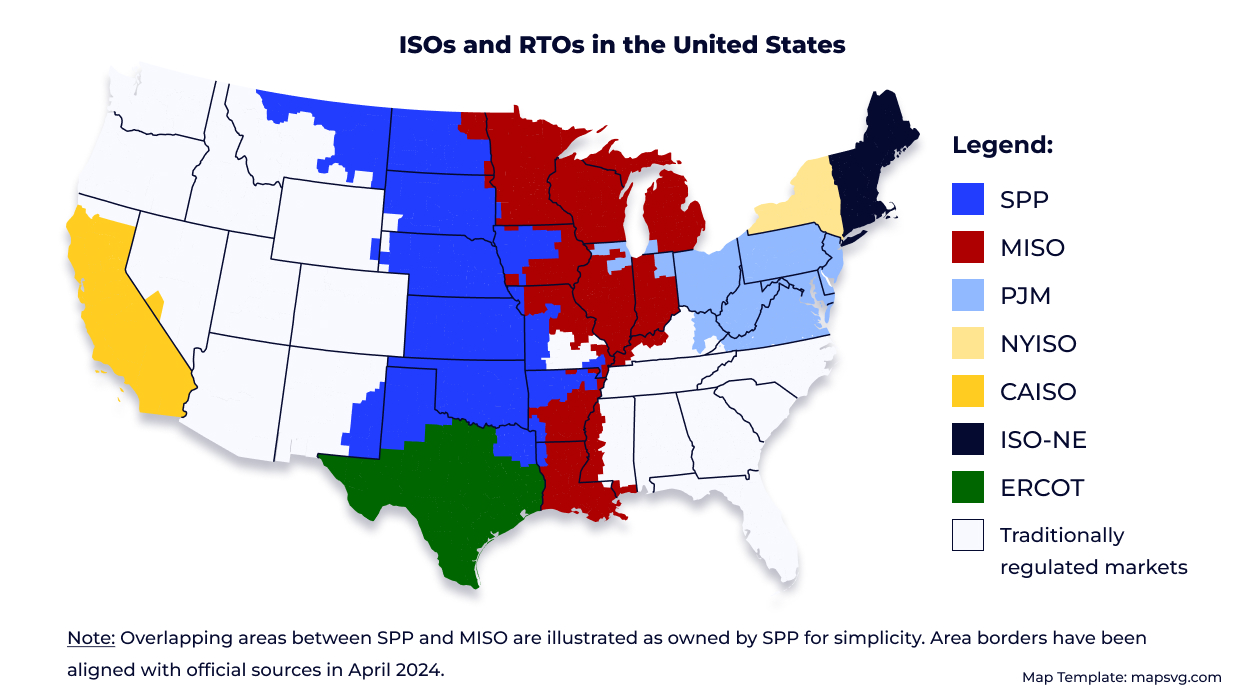
Seven Independent System Operators (ISOs) and Regional Transmission Organizations (RTOs) operate 66% of the US electricity load. ISOs coordinate, control, and monitor the power grids within their operational areas.
In traditionally regulated regions (shown above in white), power utilities are responsible for system management as well as delivery to retail customers. These areas don’t have financial trading currently, though there are plans to expand organized markets to these regions.
The US power market uses a nodal system. Each node, or place on the power grid where electricity is injected or removed, represents an opportunity for financial trading.
In the US, you can execute virtual (not physical) trades on nearly 12,500 nodes, bringing exponential opportunities to traders. Each node has a unique clearing price per market time unit.

Source: Yes Energy’s PowerSignals
In this chart, the day-ahead price and the real-time price are the green and yellow lines, respectively. The difference between these is called the DART (day-ahead to real-time) spread, and this is where financial opportunities lie. (We broke down how real-time power trading works in more detail.)
You can trade at thousands of nodes, and you can make financial trades for each unique hour of the day (hours one through 24).
Trade strategies can change by the hour for a long (buy) or short (sell) position). In addition, you can place transactions with multiple ISOs each day.
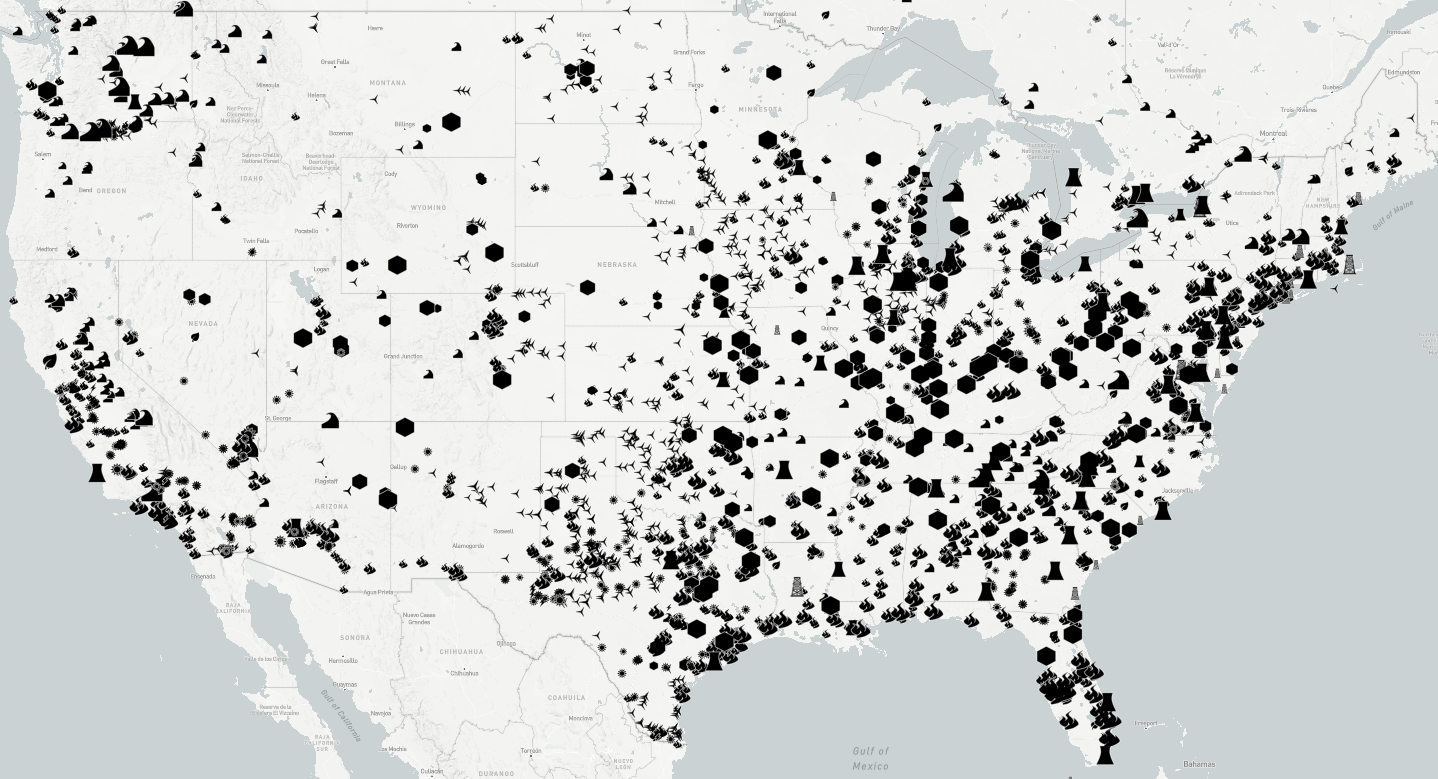
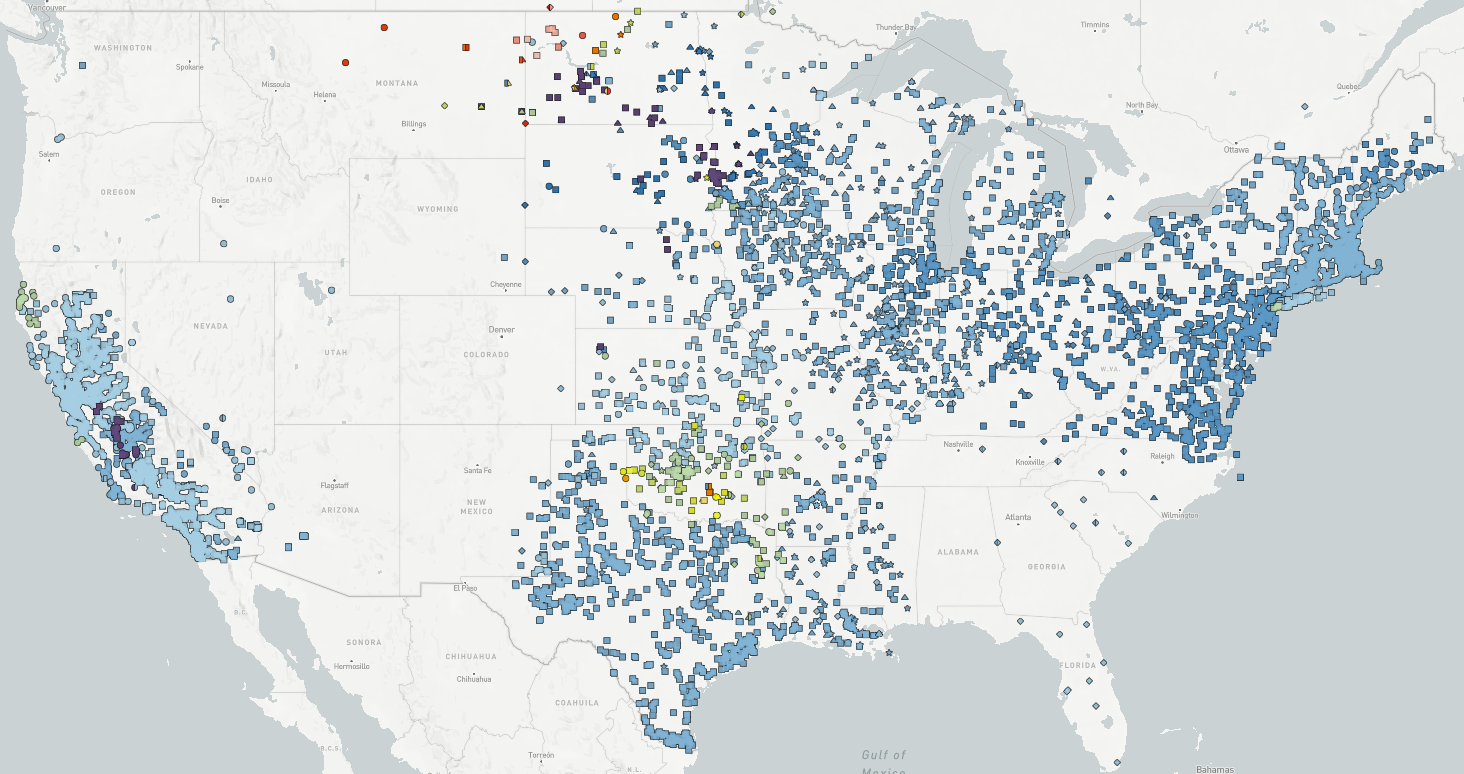
Source: Yes Energy’s PowerSignals
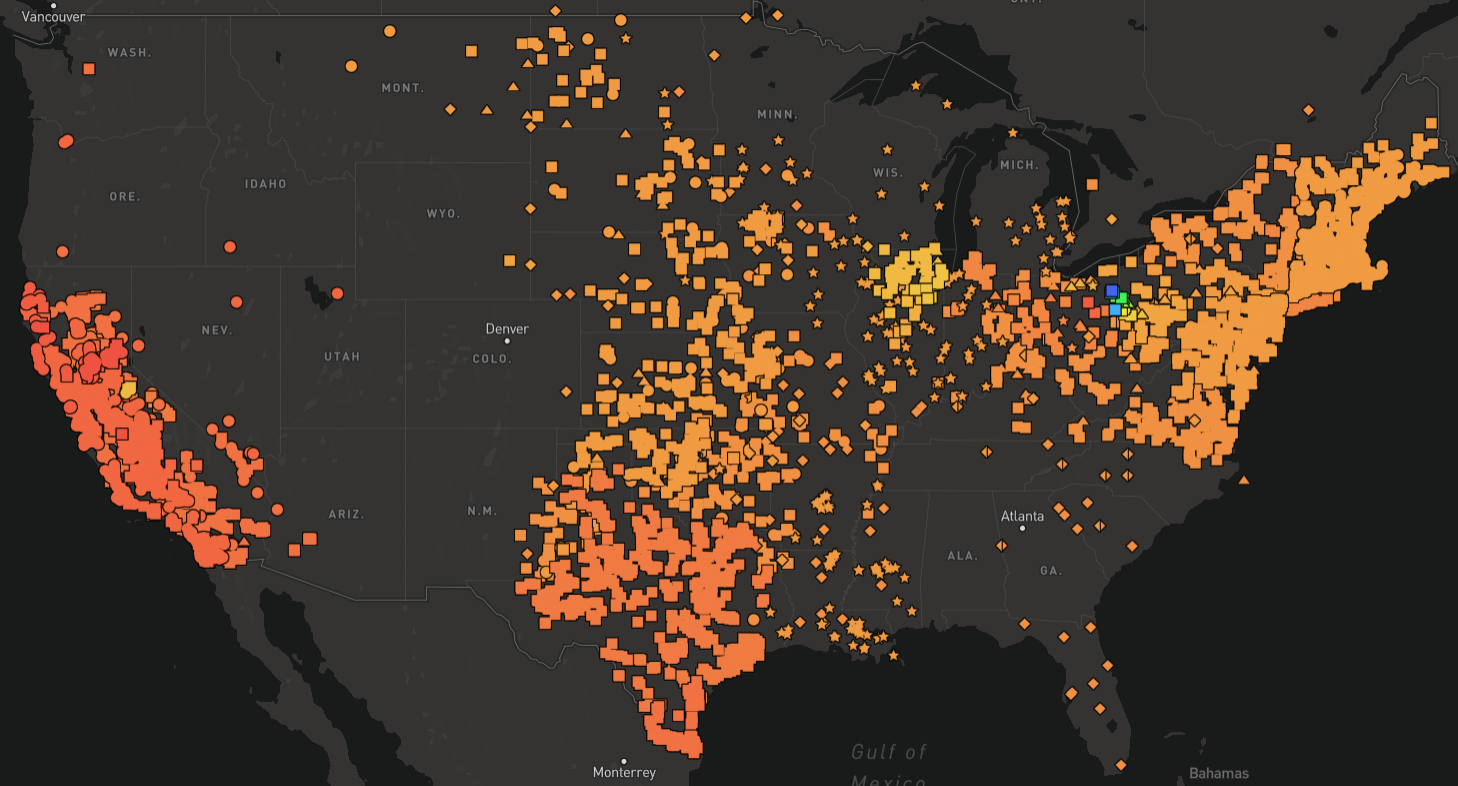
The above map shows the various power generation sources (wind, solar, gas, etc.) throughout the nation. Each region has a unique makeup, which also creates opportunities because this changes price behavior. For example, prices may drop when there is plenty of sunshine creating solar power and rise at night when this ends.
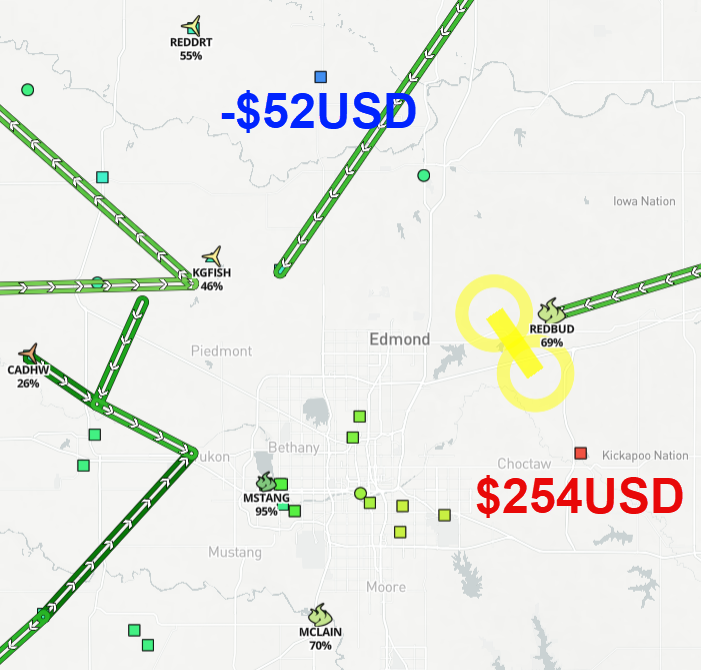
Source: Yes Energy’s PowerSignals
Localized volatility provides further arbitrage opportunities. Grid congestion, for example, causes price divergence. Virtual and spread trading possibilities are common around congestion.
In the graph above of the Southwest Power Pool (SPP), you can see the greater Oklahoma City area, where there’s a negative price in the north and a positive price in the south. The yellow represents a transmission constraint on a piece of equipment that is in danger of power transmission overload.
The Differences Between European and US Power Markets
If you’re currently trading in the European markets, trading in the US markets may provide you with even greater opportunities, but there are significant differences between markets in Europe and the US.
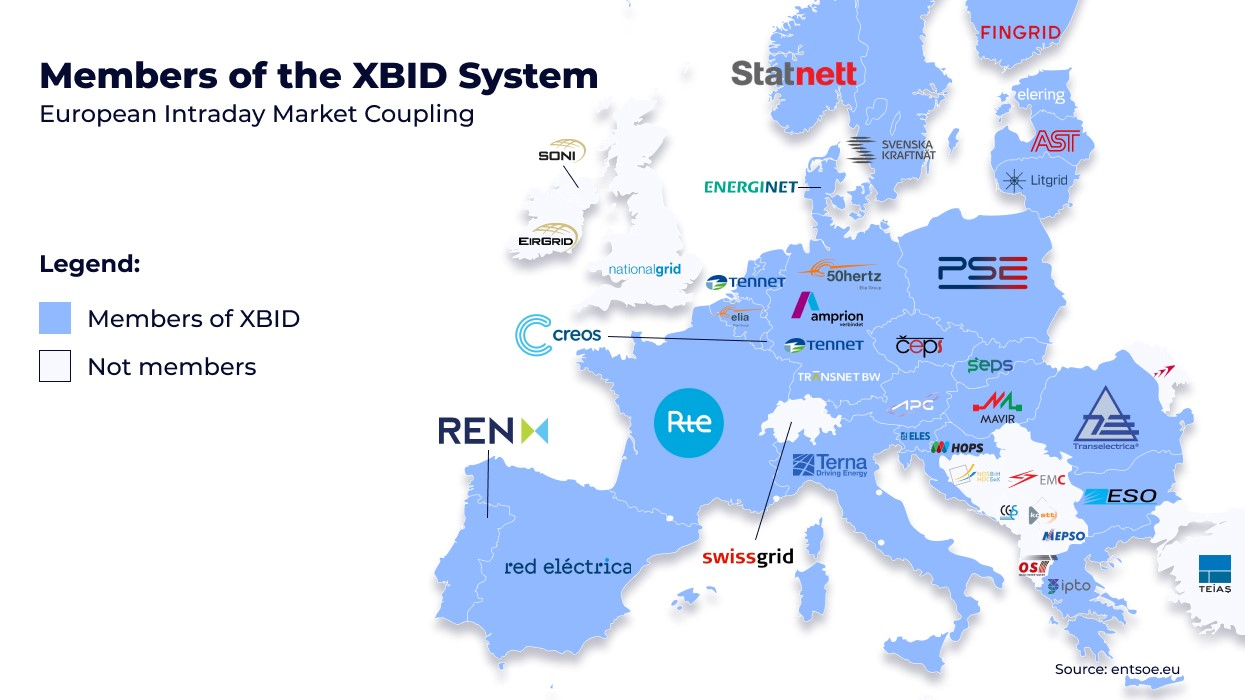
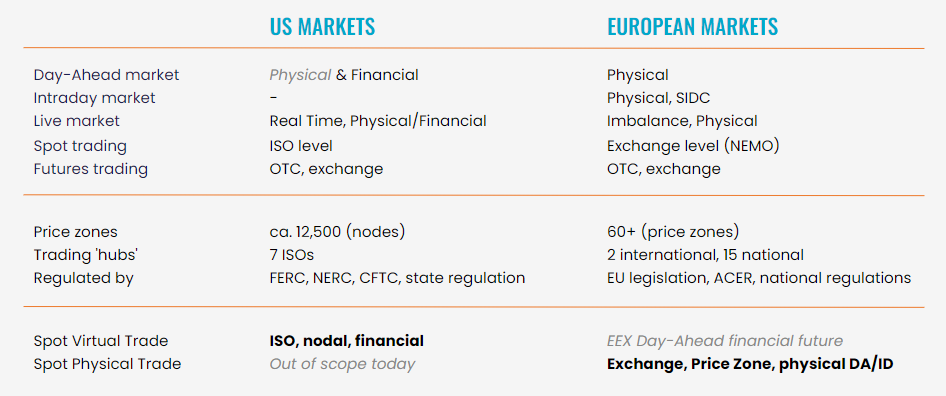
In the US trading is virtual, while in Europe it’s physical. In the European power markets, the markets are divided into zones largely by country, and you can participate in over 25 countries’ markets.
In Europe, the day-ahead and intraday markets are both physical, while in the US there is no intraday market. In both markets, there are futures trading.
A spot virtual trade in the US market is done at the ISO level. In European markets, a spot virtual trade doesn’t really exist apart from the European Energy Exchange (EEX) day-ahead financial future, which doesn’t change the price of the physical market.
We’ve summarized the differences in the chart below.
Comparing Power Trading in US and European Markets
How Does Financial Trading in US ISO Markets Work?
Virtuals, spreads, and financial transmission rights (FTRs) are essentially swaps. The fixed price is set in auctions where you are awarded the trades, and the floating price is set in the physical market.
Virtuals are submitted into the day-ahead algorithm, and as it is solved, you are awarded or not awarded trades (also called clearances). The fixed prices of these virtual positions are set in the day-ahead market. The floating price, or the price that determines your final settlement, is based on the real-time price of the node.
You can bid for the next day – one whole day, one hour, or anything in between. Each node or tradeable point is what you base your trade on, so there’s a large amount of granularity.
Spreads are a paired virtual buy and virtual sell, which you transact as a pair and clear as a pair (if you clear them). You submit a bid for the price difference between two nodes – a source (buy) and sink (sell). The fixed prices of these spread positions are set in the day-ahead market. The floating price, or the price that determines your final settlement, is based on the real-time price of the nodes.
Financial transmission rights (FTRs) are longer in duration. You can trade them monthly all the way to four years in the future. They’re similar to the shorter-term spread contracts, where you have a source and a sink, which are bid as a pair.
You can bid into FTR auctions once a month, generally. These FTR auctions determine what trades are awarded and the fixed price of those trades. The floating price of these are settled on the day-ahead prices.
FTRs are meant to be a hedge where you might be sourcing your generation and sinking your load, or you might use them as a speculative trading instrument.
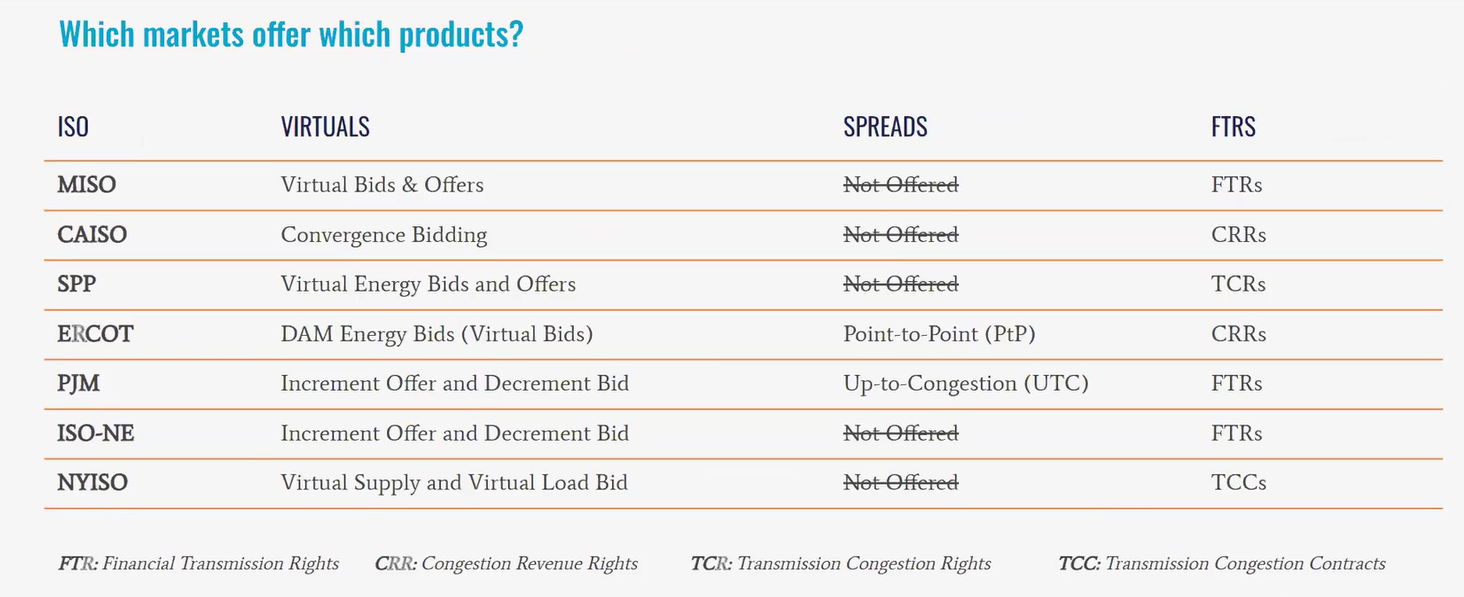
Summary of Trade Types in US ISO Markets
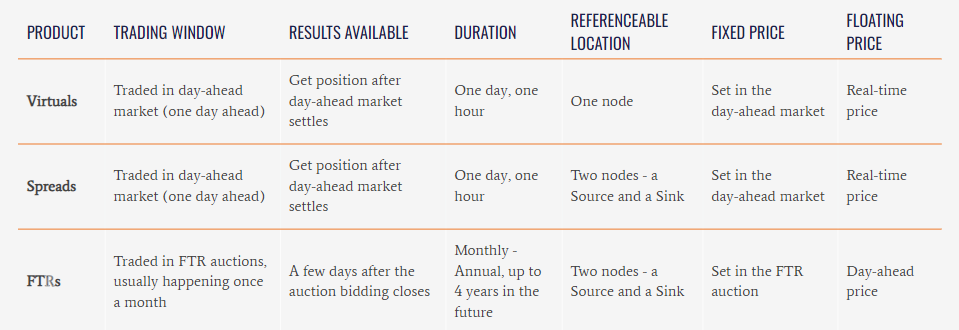
The below chart is a cheat sheet because these trades all behave essentially the same way, but each ISO has a different term for them.
Trade Types Offered in Each US ISO Market
Which ISO Markets Are the Largest for Virtual Trading?
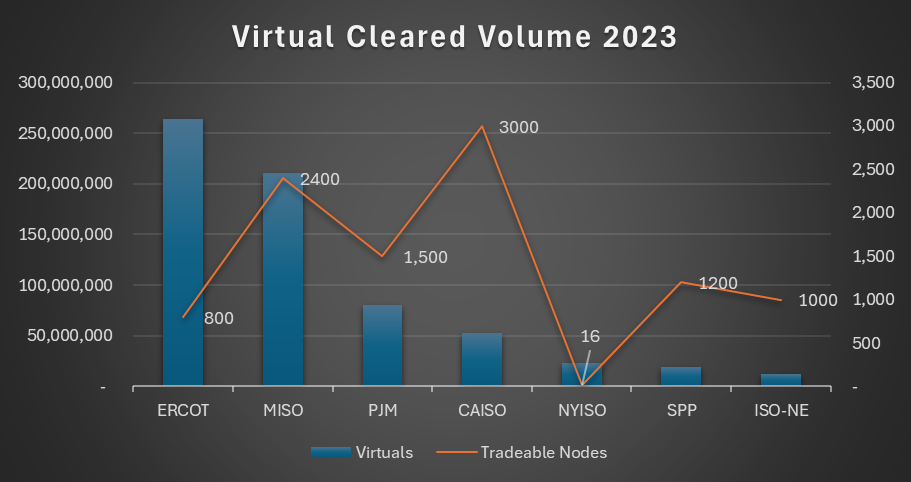
For virtual markets in 2023, the market with the most MWh volume was the Electric Reliability Council of Texas (ERCOT). In ERCOT the uplift fees are often lower than in other markets. Uplift fees are make-whole payments the ISO offers a generator. These lower variable fees make it an attractive market to trade in. However, you can participate in any or all ISOs. There’s significant opportunity in all markets, not just ERCOT.
Which ISO Markets Are the Largest for Spread Trading?
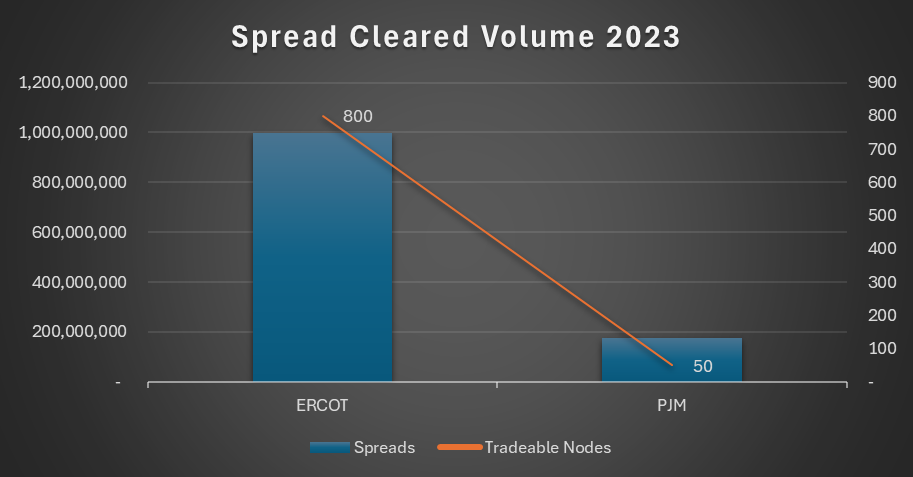
Currently only two markets allow spread trading: ERCOT and the PJM Interconnection (PJM). In this case, ERCOT has more tradeable nodes, which is driving the higher volume in that market.
Which ISO Markets Are the Largest for FTR Trading?
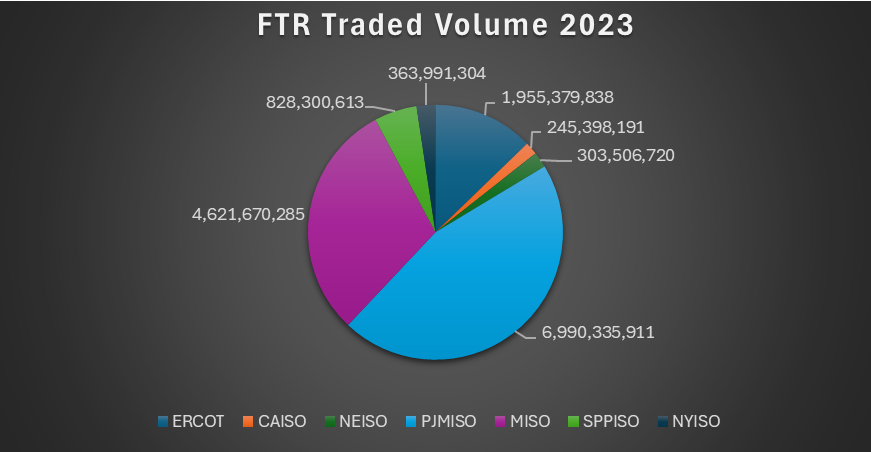
FTR market volume is by definition capped by the physical market capacity. Therefore, the traded volume reflects that, with PJM having the largest volume (as the largest physical market).
FTRs are an illiquid instrument, which makes them more risky than virtuals and spreads.
So why do people trade them? The returns can be higher because of this risk, and they have lower variable transaction fees than virtuals and spreads.
Ultimately, many organizations choose to trade all three products.
How Do You Get Started Trading in US ISO Markets?
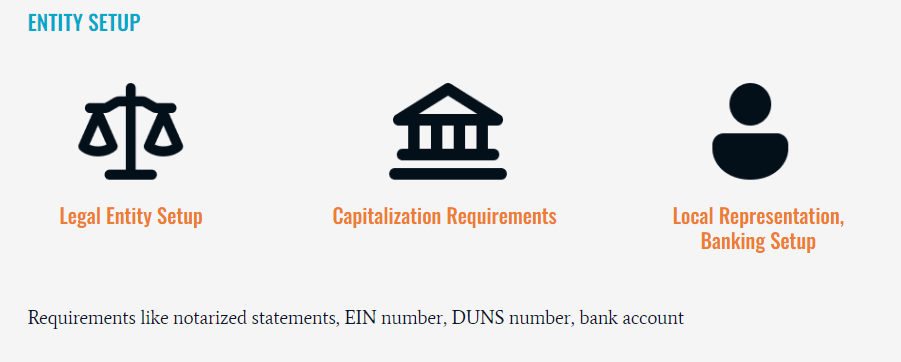
Entity Setup
First, you need to set up a legal entity. Your organization will need to have some internal conversations on the right legal structure (LLC versus INC, for example) and other corporate setup considerations (see below). Time to Market can guide you on these.
ISO Entry
Before beginning your ISO registration, you’ll need to be able to demonstrate that you have proper training, risk policies, and capitalization levels (see below). Having these setup will ensure your application moves quickly through the process and isn’t delayed.
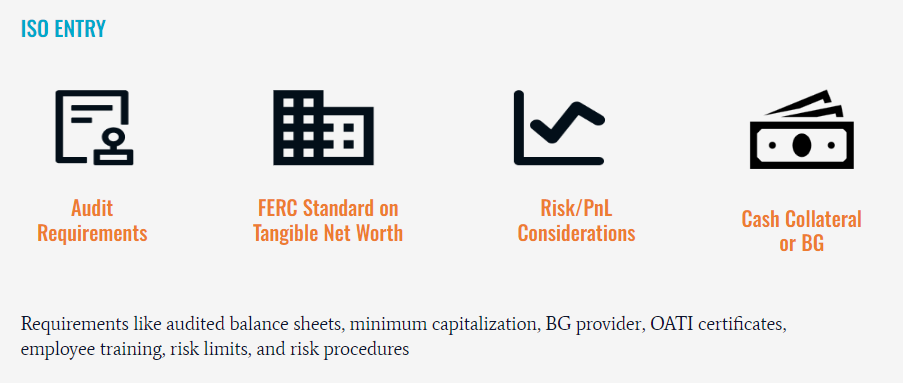
As part of your application (and annually thereafter) you need to certify that you meet these requirements. To learn more about these certifications, check out our blog What to Know About ISO/RTO Annual Certification Requirements.
Meeting ISO Market Requirements for Entry Quickly
One of the ISOs’ and RTOs’ primary concerns is ensuring that market participants have strong risk management practices. They expect that market participants will have written risk management policies, procedures, and controls, all approved by an independent risk management function.
In addition to these risk management policy requirements, ISO and RTOs require that market participants trading FTRs have at least weekly measurement (and oversight of) of FTR mark-to-market (MtM) exposure and FTR risk calculations.
To learn more about the specifics of these requirements, please check out these blog posts:
Not only do you need to certify that you have these calculations and processes in place, the ISOs audit participants to ensure they’re meeting the requirements on an ongoing basis.
Although there aren’t the same ISO requirements for risk calculations on virtuals and spreads, there’s still plenty of value to having risk management oversight for those trades as well.
To learn more about the value of managing your virtual and spread risk, check out our blog on How to Maximize Virtual Energy Trading Returns and Minimize Risks.
Yes Energy Can Help!
Oversee Your Risk and P&L with Position Management
Yes Energy’s Position Management™ solution provides the nodal power market middle office with a turnkey, consolidated solution for oversight of your trading activities.
We handle the automated deal capture of your virtual, spread, and FTR portfolios, and using our industry-standard MtM and risk calculations, you can be confident you’re getting accurate values for your ISO certification, financial reporting, and decision-making needs.
This is all delivered to your team through automated email reporting, a visual middle office dashboard (see below), and easy-to-integrate data API.
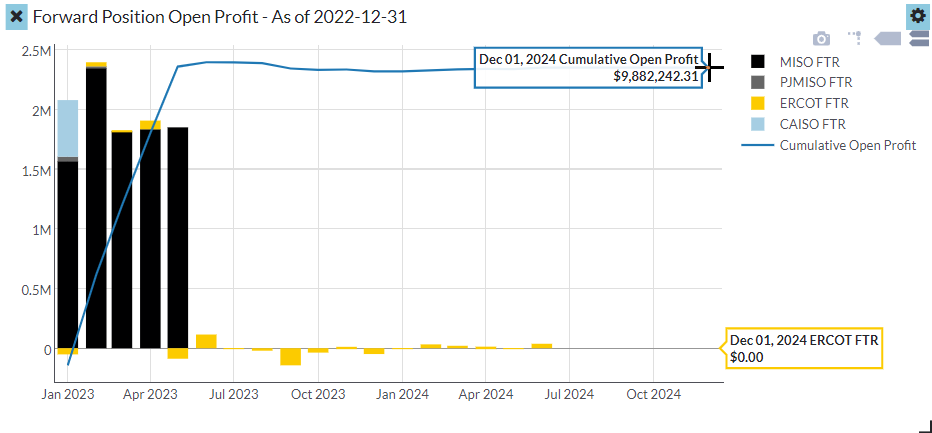
Source: Position Management Open Profit (mark-to-market) chart which demonstrates this company has an unrealized gain of US $9.9 million as of December 31, 2022.
With Position Management, you gain an automated source of deal capture, realized and unrealized P&L, and risk calculations, along with a solution for more granular reporting. All of this leads to less manual effort, and less errors, in your middle office processes.
Learn more about Position Management today, or schedule a demo to see how this solution can help solve your middle office challenges with virtual, spread and FTR trading!
Find Trading Opportunities with PowerSignals
Another product that can help is Yes Energy’s PowerSignals®, which can help you identify opportunities in the ISO markets. You can quickly survey the market and see nodal-level prices. Whether you use our visual analytics tool or look at the pure data, you can see the largest day-ahead, real-time (DART) spreads and what would be a return on your virtual trade.

Source: Yes Energy’s PowerSignals
Also, you can see some proprietary information around line flow and power plant output.
You can quickly jump into the Nodal Profile Tool and see a time series view of the prices in the day ahead and real time.

Source: Yes Energy’s PowerSignals
Submit your Virtual and Spread Trades to the ISO Markets with Submission Services
Submission Services takes the guesswork out of DA virtual and spread trade submission. It ensures you align to and fulfill ISO requirements with comprehensive validation logic being directly embedded and enabled in the submission process.
This is all delivered to your front office through a visual portfolio analysis dashboard and an easy-to-integrate data API.
Some of the validation processes that Submission Services includes are:
- Energized and valid nodes
- Electrically similar nodes
- ISO-specific rules (volume and price rules)
- Wash trades
Our team of market experts stays updated on ISO developments and ensures our solutions are proactively updated as required. This is all part of Submission Services providing exceptional performance in trade execution and validation.
Put our knowledge and expertise to work for you so that you can keep the focus on maximizing your returns in the DA market.
Learn more about Submission Services today, or schedule a demo!
Conclusion
Whether you are new to power markets in general or just to US power markets, you can explore tools to help you enter – and thrive – in the markets with Yes Energy.
Yes Energy® is how traders, power companies, and asset managers and developers can finally make sense of the complex, rapidly changing power market. You get accurate and timely data, comprehensive tools, and a specialized partner to help you make the right decisions every day.
Want to learn more about how to enter the US ISO markets? Request a demo or talk to our team of power market experts.

 About the author: Jake Landis has been involved in nodal power markets since 2007. He previously worked at a large utility company in real-time trading and asset optimization through term and financial power products. Additionally, he spent time trading financial products with a private trading firm before joining Yes Energy in 2019.
.jpg?width=91&height=121&name=Stephanie%20Staska%20(1).jpg) About the author: Stephanie Staska is the director of trade and risk products at Yes Energy. She has worked in energy risk management and compliance for the past 20 years, including time at Twin Cities Power, Cargill, and Split Rock Energy.
About the author: Stephanie Staska is the director of trade and risk products at Yes Energy. She has worked in energy risk management and compliance for the past 20 years, including time at Twin Cities Power, Cargill, and Split Rock Energy.
About the author: With over a decade of experience trading power, Paul Pontenagel is the managing director of Time2Market– the only independent company providing market access services to Power and Gas market participants worldwide. He brings invaluable experience of trading European power and understanding of traders’ needs, ensuring fast and efficient market entry.
