


Share this
Do you have a number of traders executing virtual energy trades and want to understand their trading patterns and the risk they’re taking? As a trading, risk, or compliance manager, it can be challenging to have timely, accurate, and complete information on positions and their corresponding risks in the virtual energy markets.
We have a solution.
Historically, many energy trading organizations have focused on the risk of financial transmission rights (FTRs) and exchange-traded contracts (futures and options) because of the tenor of those transactions, and external pressures and regulations.
Virtual and spread (called “up to congestion” in the PJM Interconnection [PJM] and “point to point” in the Electric Reliability Council of Texas [ERCOT]) trades have a shorter time horizon. However, historically there have been large drawdowns for participants in the virtual and spread markets, including those in the tens of millions of dollars (or more) for a handful of days during the 2014 polar vortex.
These types of market events highlight the need for tracking virtual and spread trading and the corresponding risk usage.
Trade Capture Is Challenging
First, let’s lay the foundation for tracking virtual and spread trading patterns and risk usage by starting with timely trade capture for these portfolios.
Since many portfolios have thousands of trades, doing manual trade capture for virtual and spread trades is time-consuming, error-prone, and comes with inherent control risks. Extending this by the number of traders and Independent System Operators (ISOs) your desk participates in makes this particularly challenging. Given this, market participants are increasingly turning to automated trade capture for these trade types. Ensuring you have this data as soon as it’s available from the ISO markets enables timely risk calculations for your reporting, analysis, and control framework.
Another hurdle with trade capture of virtuals and spreads is the security of this data. You need to ensure only those authorized are able to see any trade-level details in these portfolios – i.e. not everyone in your organization. This not only protects the integrity of the traders’ strategies but helps to reduce the organization’s regulatory risk (i.e. collusion).
You Need Virtual and Spread Risk Calculations for Effective Energy Trading Risk Management and Compliance Programs
When analyzing energy market risk, often exchange-traded contracts (futures and options) and FTRs take priority because of the highly publicized defaults (including Greenhat) and regulatory requirements for risk management oversight. It’s easy to overlook virtual and spread transactions for this reason.
Many market participants today use the ISO credit (collateral) requirements as a proxy for risk, but due to the significant variation in these policies, this data is of limited value in this context. Because of this, it’s easy for a commercial leader, or a risk or compliance manager, to have missing or incomplete risk calculations on their team’s virtual and spread portfolios.
These trade types do have market and regulatory risks. Without insight into these portfolios and their risk usage, your organization may suboptimally allocate capital, sustain unanticipated trading losses, and miss out on additional compliance monitoring capabilities.
Analyzing Risk-Adjusted Trader Performance Can Improve Trading Capital Allocation Decisions
When managing traders, it can be difficult to track risk-adjusted performance. Profit and loss (P&L) is frequently the easiest metric to measure performance, but it doesn’t show the risk used to generate that P&L. Analyzing risk-adjusted returns is valuable to understand where to allocate your trading capital.
In the chart below we explore this while we analyze the performance of three hypothetical virtual and spread traders.
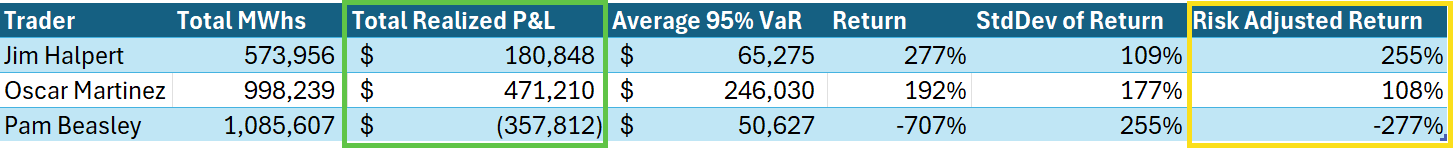
Virtual and Spread Risk-Adjusted Returns
At first glance, you may think that Oscar was your best trader for the period – after all, he did make the most. But if you adjust his returns for the risk he took, you can see that Jim made the best returns for the risk he was using. Assuming his strategy is scalable, it may be appropriate to allocate more capital to Jim to improve the company’s risk-adjusted return.
Energy Trading Risk Management Teams Need Insight into All Market Risks
As a control function within a trading organization, the risk management team should have access to positions and risk calculations on all products generating market risk. This team needs to monitor the usage of the risk limits that the owners, investors, board, or risk committee set to help prevent unacceptable company losses. These limits can include volumetric limits, value at risk (VaR), stress-testing figures, and drawdown limits.
If there’s a blind spot to virtual and spread trades, it could leave your company vulnerable to significant, unexpected losses.
Using the same dataset that we used for the risk-adjusted return calculations, we pulled the largest daily drawdown for each of the hypothetical traders for the period in the chart below. (Your organization may not be trading the same volume or strategy as in this example, so these values may not reflect your company’s virtual and spread risk usage or risk appetite.)
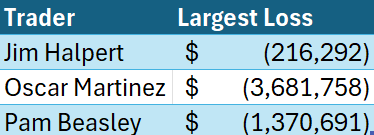
Largest Daily Drawdown by Trader
Measuring potential losses and communicating those internally is important to set the expectation of earnings volatility throughout the company. Many times we’ve seen an investor or risk team spooked by losses that were “not expected,” which can halt trading while resetting expectations. It benefits everyone in the company to measure and report the risk on all trading instruments to avoid situations like this.
Analyzing Patterns in Risk Usage Is a Useful Compliance Monitoring Tool
As any compliance team knows, checking for all the activities that could catch the eye of a regulator is challenging. Many organizations have well-established compliance programs to look for banned trading practices or practices that have resulted in significant fines recently.
A challenging compliance task to monitor for is the “I’ll know bad when I see it” trading activities.
The best-established monitoring programs for these types of activities are analyzing changes in “trading behavior,” not because that means those changes in behavior are bad, but because it leads to valuable conversations about intent between the compliance and trading teams.
One such analysis of trading behavior for virtuals and spreads is analyzing risk usage patterns. For example, during the PJM Marginal Loss Surplus Allocation enforcement cases relating to up-to-congestion (spread trading) activity from 2010, it was alleged that pseudo-wash trades were executed to collect these surplus allocations. In this case, noticing that risk usage dropped off dramatically could have led to a valuable discussion between the compliance and trading teams about why the trading strategy changed.
These are just some ways that virtual and spread risk usage data can help when making decisions around capital allocation, preventing unexpected losses, and avoiding compliance incidents.
Yes Energy Can Help Your Team with Virtual Risk and Compliance Management!
Yes Energy’s Position Management™ solution provides the nodal power market middle office with a turnkey, consolidated solution for oversight of your trading activities. We handle the deal capture of your virtual, spread, and FTR portfolios, and using an industry-standard risk methodology, you can be confident you’re getting accurate values for your reporting and decision-making needs. This is all delivered to your team through automated email reporting, a visual middle office dashboard (see below), and easy-to-integrate data API.
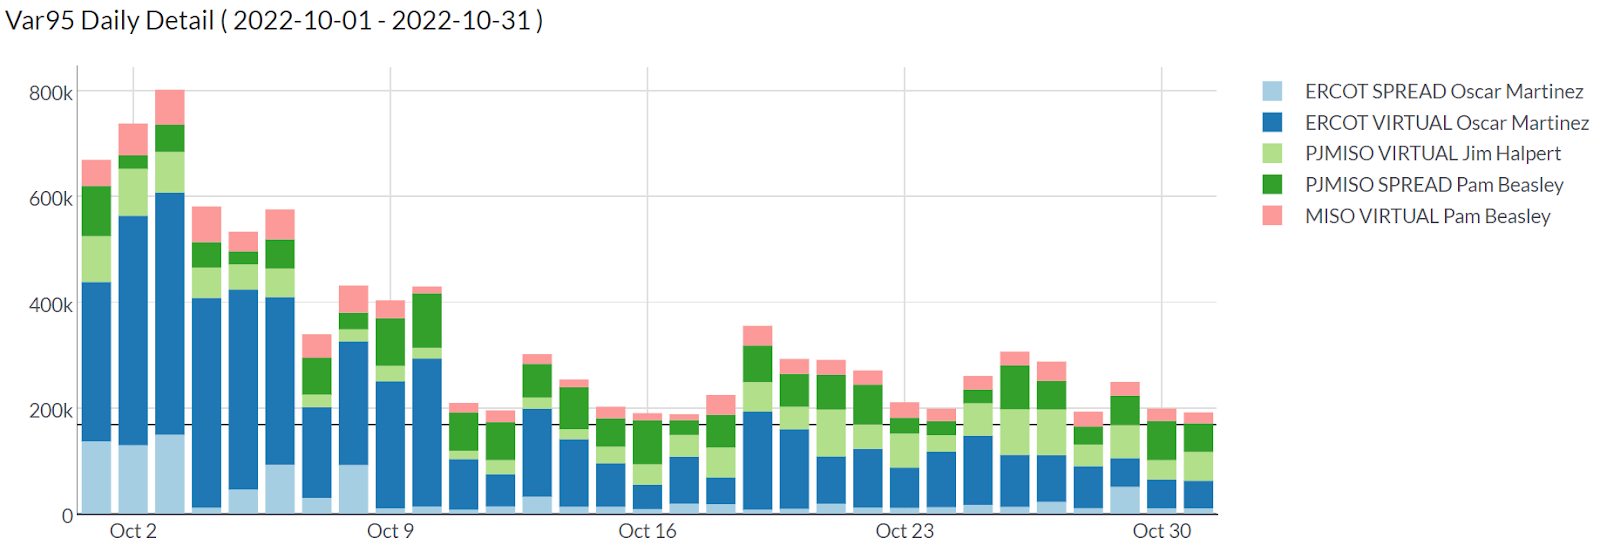
Position Management Virtual and Spread VaR chart
With Position Management, you gain an independent source of deal capture and risk calculations, reducing the risk of manual mistakes or interference in your energy trading risk management processes. The foundation of the solution is Yes Energy’s data management activities, which include secure trade capture and managing price capture/changes, node remappings, and inevitable ISO changes.
Learn more about Position Management today, or schedule a demo to see how this solution can help solve your middle office challenges with virtual, spread, and FTR trading!
.jpg?width=92&height=122&name=Stephanie%20Staska%20(1).jpg) About the Author: Stephanie Staska is the director of trade and risk products at Yes Energy. She has worked in energy risk management and compliance for the past 20 years, including time at Twin Cities Power, Cargill, and Split Rock Energy. Stephanie received her MBA and her bachelor's degreee in actuarial science and mathematics from the Carlson School of Management at the University of Minnesota. She enjoys traveling and spending time with her family.
About the Author: Stephanie Staska is the director of trade and risk products at Yes Energy. She has worked in energy risk management and compliance for the past 20 years, including time at Twin Cities Power, Cargill, and Split Rock Energy. Stephanie received her MBA and her bachelor's degreee in actuarial science and mathematics from the Carlson School of Management at the University of Minnesota. She enjoys traveling and spending time with her family.
