


Share this
by Cliff Rose
Background
Asset developers are companies involved in siting and building generation assets on the power grid. The primary focus of US power developers is on wind, solar, and energy storage projects, which benefit from:
- Corporate demand for CO2 offsets
- Higher fossil fuel prices
- Recently enhanced federal tax incentives (i.e., the Inflation Reduction Act)
The development process ends when construction capital is committed to a project (the financial investment date or “FID”). At that point, the project will likely proceed to commercial operation.
 Achieving FID requires
- completion of construction and operating requirements (e.g. land acquisition, permits, interconnection agreement, Energy Performance Certificates, etc.), and
- making a case for the revenue potential of the project in the local power market.
In the case of projects with power purchase agreements (PPAs), the asset developer makes the revenue case to the long-term buyer. In the case of merchant projects, the asset developer makes the revenue case to equity and debt providers.
In either case, the asset developer needs to demonstrate that power market fundamentals are attractive at the site. Typically, the revenue case involves backcast analyses at the site and long-term projections of price scenarios at the site.
A major competitive advantage for asset developers is siting projects with a better-than-average revenue case (i.e. siting their project where nodal pricing is more favorable). The effort to find the most favorable nodal pricing is complicated by the project’s operating constraints, such as wind/solar conditions, transmission capacity, land access, water rights, environmental issues, and regulatory framework. This means asset developers must assess the revenue case for many potential site options to find the optimal siting solution.
Three Types of Power Market Data Analyses
When a company is deciding where to site a power plant, it typically engages in three main analyses that deal with wholesale power market data.
- Market Fundamentals Analysis: Looking at historical pricing around a site, what drives those prices, and at a high level how prices might change in the future
- Price Forecast: A long-term nodal price forecast typically done by Powerflow modeling that accounts for changes to the generation and transmission system, typically performed by consultants
- Interconnection Study: A Powerflow-based study of feasibility and upgrade costs to interconnect the project, typically performed by consultants
Asset developers frequently engage consultants for a price  forecast and interconnection study; however, many will leverage power market data to perform their own market fundamentals analysis. At its core, a project siting market fundamentals analysis consists of:
- Understanding historical prices around a site
- Drivers of those historical prices
- A high-level understanding of how prices might change in the future
Historical Price Analyses
Finding a Proxy Node
The first step in examining historical pricing is finding a suitable proxy node. For this, you typically want the closest node to your specific site, which GIS software with accurate price node and substation mapping can help identify. According to Jim McDowall, business development manager for Saft Batteries, “If you are two miles away from the substation … you could be losing 5% of your power between the energy storage system and the point of interconnection, and that is certainly an issue in terms of the power purchase agreement.”
Understanding Historic Pricing and Drivers
Once you’ve found your proxy node, you can analyze historical ISO pricing and market fundamentals data (i.e., load, generation, congestion, weather) to understand historic pricing and drivers at your proxy node. Typically, asset developers analyze two to three years of pricing and fundamentals data to tell the story of what prices have been and what has driven them.
To give a little more context, renewables developers typically look for sites of high wind/solar-weighted prices and favorable basis to an off-taker that are likely to stay that way. These developers usually use wind- or solar-weighted basis calculations. Energy storage developers typically look for sites with relatively higher price volatility that can reasonably be expected to stay that way. These developers typically use volatility metrics such as daily price spreads to inform their decisions.
Accurate and reliable data is key for better decision-making. At Yes Energy, that’s why we focus on providing clean, complete, accurate, and reliable data.
Future Price Trends Analyses
Once they understand historical pricing and drivers, asset developers need to explore how conditions on the grid may change in the future and how this might impact price. They can do this by looking at three fundamental factors:
- Planned/announced generation additions
- Planned transmission additions
- Long-term load growth forecasts
It’s critical to have accurate information on all three to directionally assess the future state of the grid and how it may impact your project. Planned and announced generation and transmission additions in particular can be difficult for developers to analyze, and often require either a vendor or in-house analyst to thoroughly assess interconnection queue and transmission planning data to understand grid change.
Using FTRs for Forward Pricing Analysis
Financial transmission rights (FTRs) are a tool used to hedge future congestion risk. Utilities, independent power producers, and speculative traders typically use them, but FTRs can give insight into how the market is pricing future congestion to help understand whether congested areas will remain that way.
Below is a screenshot from Yes Energy’s tool, FTR Price Map, showing all ERCOT FTRs for 2025. As we can see, the market expects South Texas to have the most negative congestion in 2025 and the Houston area to have the most positive congestion.
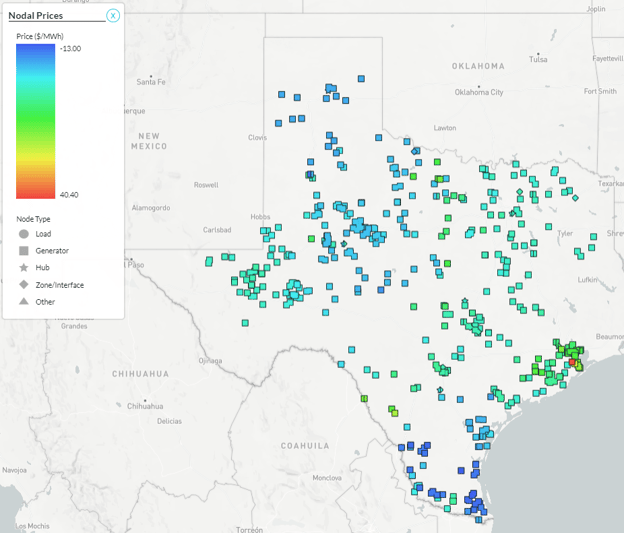
In the example above, developers can visualize the congestion caused by FTR constraints across longer timeframes in order to help predict future growth – a critical part of the site analysis process.
Key Takeaways
The most critical elements of a market fundamentals analysis include finding the closest proxy node, analyzing historical pricing to see if it’s favorable, identifying the causal drivers of that pricing, then using forward-looking data including the interconnection queue, long-term load forecasts, and potentially FTRs to directionally assess forward pricing. All are essential to determining where to site a new generation project.
At Yes Energy, we deliver comprehensive nodal power market data as an integrated, complete data set with flexible options to ingest and analyze the data. This makes it quicker and easier for traders, power companies, and asset managers and developers to understand market developments so they can make the most informed decisions.
To read our in-depth analysis of how to use Yes Energy’s tools to conduct a battery sitting analysis, download our white paper here.
For more information on how Yes Energy® can help support your market fundamentals analysis, request a demo.

At Yes Energy, our teams are comprised of experts entirely focused on power market data. Yes Energy’s purpose-built tools allow you to easily analyze market moves with unparalleled front-end products so that you can spend your time acting on data, not aggregating it.
 About the author: Cliff Rose is a senior product manager at Yes Energy currently focused on building products that help power plant developers leverage wholesale power market data in their decision-making. He has 12 years of experience helping companies navigate power markets in both a consulting and software development capacity. Outside of work, you can find Cliff engaging in stereotypical Colorado activities such as skiing, running, and biking.
