

Share this
by Enertel AI
Forecasting is a fundamental part of security-constrained economic dispatch. Operators, traders, and asset owners need to know how the grid will change in the future and make decisions now in anticipation of those events – and they’re economically incentivized to do so. But what kind of forecasts exist, how do we know if they’re useful, and how can we use them more effectively?
What Forecasts Should I Be Using?
Forecasting in power markets is the programmatic delivery of predictions for a given horizon and with an associated value. Many forecasts are intertwined: weather is the foundational layer that influences load, solar, and wind predictions. Price forecasts generally follow, which combine gas and power futures data with transmission and plant outages. Other forecasts include binding constraints or asset-level generation.
We can measure the accuracy of these forecasts in different ways, but most practitioners would agree the top models combine the highest-signal inputs with the most performant predictive technology. Users of wholesale power market forecasts can use free versions from the independent system operators, build their own forecasts with data from vendors like Yes Energy, or purchase forecasts from third-party vendors. For any of the options, it’s important to assess the accuracy of the forecasts before committing financial resources to hiring new talent, building API connections, or developing ML infrastructure.
Accuracy Metrics
There are three metrics that people generally use to assess forecast accuracy: mean absolute error (MAE), mean absolute percentage error (MAPE), and mean squared error (MSE). Unfortunately, there’s no silver bullet and each metric can and should be used to assess different types of data series.
TIP: You may see mean squared error (MSE) and root mean squared error (RMSE) used interchangeably, the latter being the square root of the former. It’s safe to assume they have the same advantages and disadvantages.
The mean absolute error is the metric that power traders and analysts are most familiar with, and it’s calculated by taking the average absolute difference between your forecast value and the actual value. It is the most intuitive answer to the question, “How far off are your forecasts from what actually happens?” It can also be very misleading when the scale of the actual values change, and it can downplay the importance of price or load spikes.
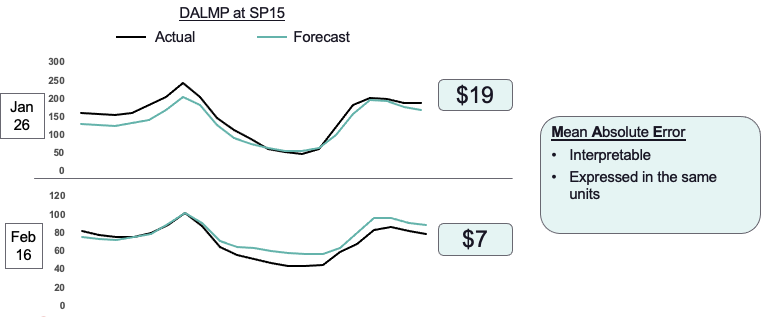
Example: The mean absolute error on two different days, one when gas prices were very high (late January) and two weeks later when they had depressed. Note the difference in scales.
Analysts who wish to control for the scale of the data series may calculate forecast accuracy using MAPE, which is calculated by taking the difference between the forecast and actual value as a percentage of the actual value. It’s relatable because it provides an indication for how far off your forecasts might be from the actual values as a percentage of the normal value from that series. Unfortunately, it’s a very poor metric to use for target series that approach zero, like most renewable generation forecasts and prices at hubs with a large penetration of zero-marginal-cost generation: zero is non-divisible, and missing forecasts close to zero can have an outsized impact on the metric.
The last metric is the mean squared error, which is calculated by taking the square of the difference between forecasted and actual values, instead of just the difference or the difference as a percentage. By its mathematical formation, MSE can be impacted greatly by outliers. Unfortunately, even if we take the root of the MSE (RMSE), the metric still holds very little contextual value.
We demonstrate the value of MAE vs. RMSE in the below image. We have two forecasts: Forecast A does well on average but misses the morning peak prices. Forecast B is more accurate in forecasting the morning peak but performs worse during the day. Which forecast is better? It depends on the metric you use.
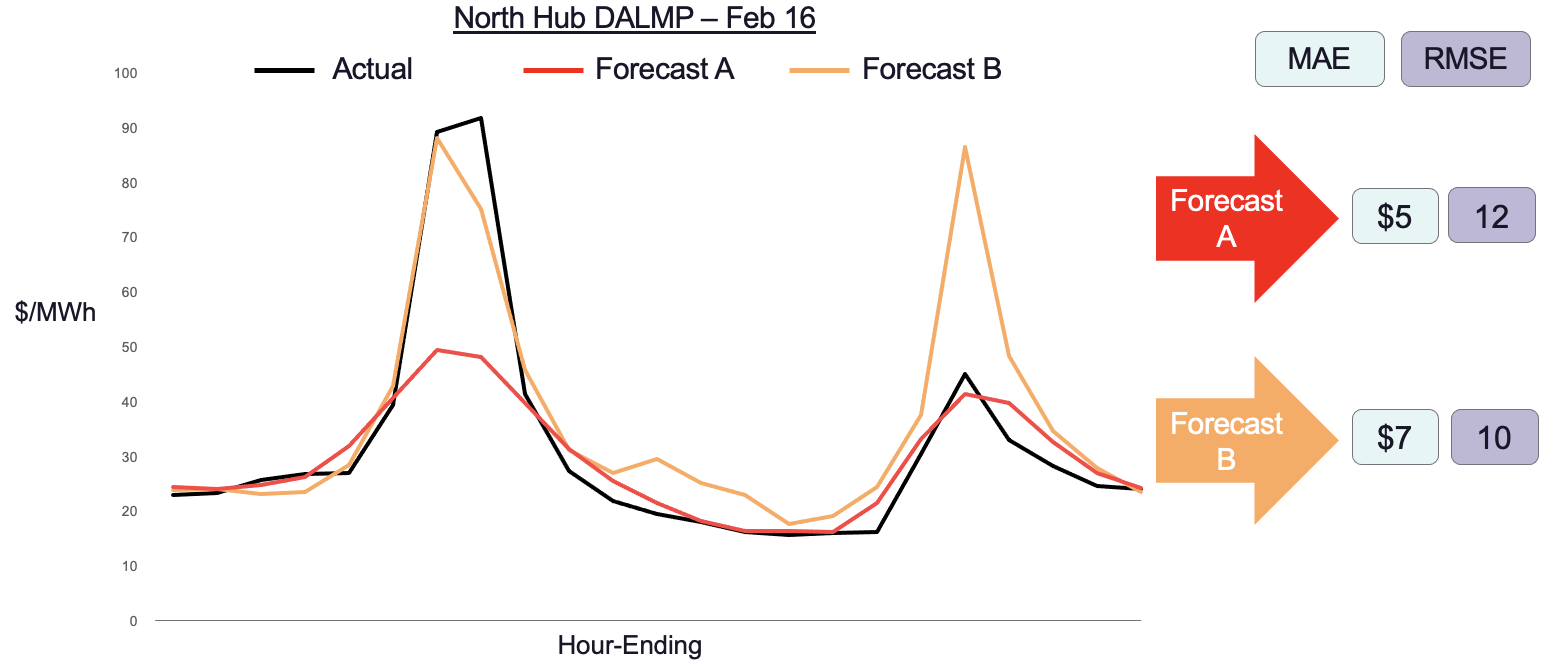
In power markets, most of the money is made or lost in the outliers. ERCOT traders are likely to benefit more from an accurate system-load forecast of 81 gigawatts versus one that does well during shoulder season. It follows that traders who select forecasts using MAE or MAPE may be overlooking forecasts that accurately predict the outliers.
Use Simple Baselines
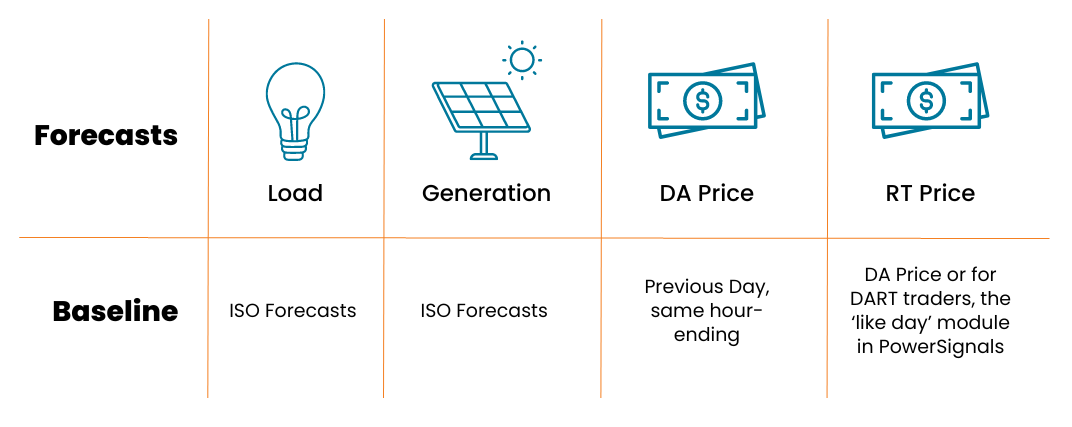
For every forecast that traders could build themselves or buy from a vendor, there’s a free baseline they can use to benchmark its accuracy. It can be tempting for traders or vendors to espouse the accuracy of their forecasts when the free benchmark for the same forecast might do just as well or better. In CAISO for example, where solar is so prevalent, the previous day’s clear can be a good predictor of the day ahead price for tomorrow because the ramp times are generally the same. Unless traders assess forecasts against the free baseline, they may be committing resources to intelligence they can get for free!
Simple Baselines
Conclusion
Forecasting in power markets will continue to increase in importance as more data gets collected and more AI tools are released to the market. It doesn’t have to be difficult to assess whether new tools are helpful or are worth the investment, but it can impact your profit and loss whether you use MAE, MAPE, or RMSE in your investment decisions.
Our recommendation for power traders? Assess all new forecasts for a reasonable amount of time using each of the metrics that make sense and compare its accuracy to a free alternative.
Enertel AI forecasts can be accessed in our PowerSignals®, QuickSignals®, and DataSignals® solutions. Want to learn more? Read about our partner Entertel AI!
