


Share this
by Jason Atwood
As renewables proliferate, we’re seeing record-breaking amounts of renewable power generation, especially in the California Independent System Operator (CAISO) and the Energy Reliability Council of Texas (ERCOT).
Let’s dive into how renewables are impacting prices, some examples of this phenomenon, and how you can prepare for this shift.
The US Interconnection Queue Is Backlogged
Generator interconnection queues have been a problem for several years, and we’ve discussed the impact of renewables on the electric power grid. In many places across the nation, there is more planned renewable generation in the queues than actual demand in most places. While Texas has a faster interconnection queue than California generally, California has higher prices for renewables, making it attractive to asset owners and operators.
The queues are mostly jammed with solar and battery projects. However, wind still has a fair amount of generation in the queue, and there are also small amounts of natural gas-fired generation in the queue.
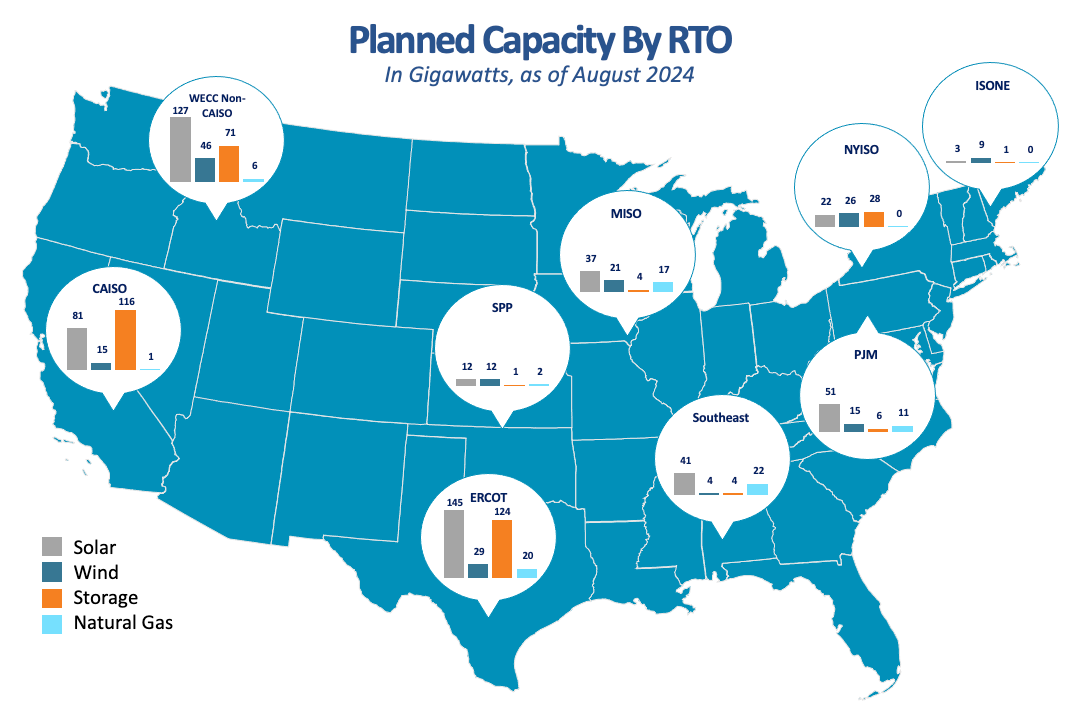
Source: Yes Energy’s Infrastructure Insights
ERCOT and CAISO Renewables Produce Power at Different Times
As more renewables come online and more fossil fuel generators capable of fast-moving regulation retire, prices become more volatile during certain times of the day.
How This Impacts Prices
Traditionally, peak energy prices occurred between the hours of 2 and 6 p.m.; however, that timeframe often extends to as late as 9 p.m. today. The reason for the peak price extension is that as solar generation starts to decrease in the late afternoon and wind generation is on the rise but has not quite arrived, higher-priced generation must fill the gap. This causes energy and ancillary service prices to spike, then return to expected levels around 10 p.m.
Batteries and demand response can help if there are enough of them connected to the grid. Meanwhile, generation and transmission outages only exacerbate this problem.
Here is a forecast of what energy and ancillary service prices can look like under these conditions. Toss in large load centers that can appear on the grid in a short time, and we might just be looking at the perfect storm for calamity.
An Example
In this example of price fluctuation throughout the day, we can see that prices spiked during hours 16 to 21 (4 p.m. to 9 p.m.).
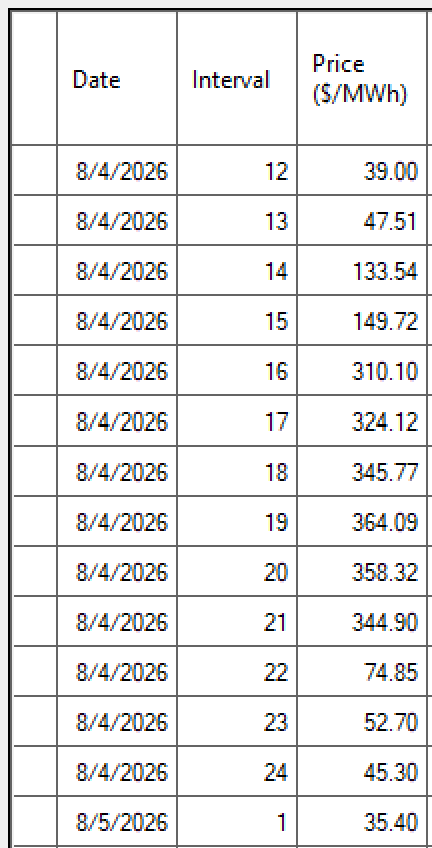
Source: Yes Energy’s EnCompass (ERCOT Forecast)
EnCompass users may also drill down into a single hour. The report below drills into the hour ending 2100 on August 4, 2026. The table in the upper right corner shows price, imports, generation, battery payback, and available capacity for ERCOT and the four individual zones. The upper left shows prices and levels for ancillary services. The bottom table shows individual generator data for the given hour and allows you to sort on various resource types.
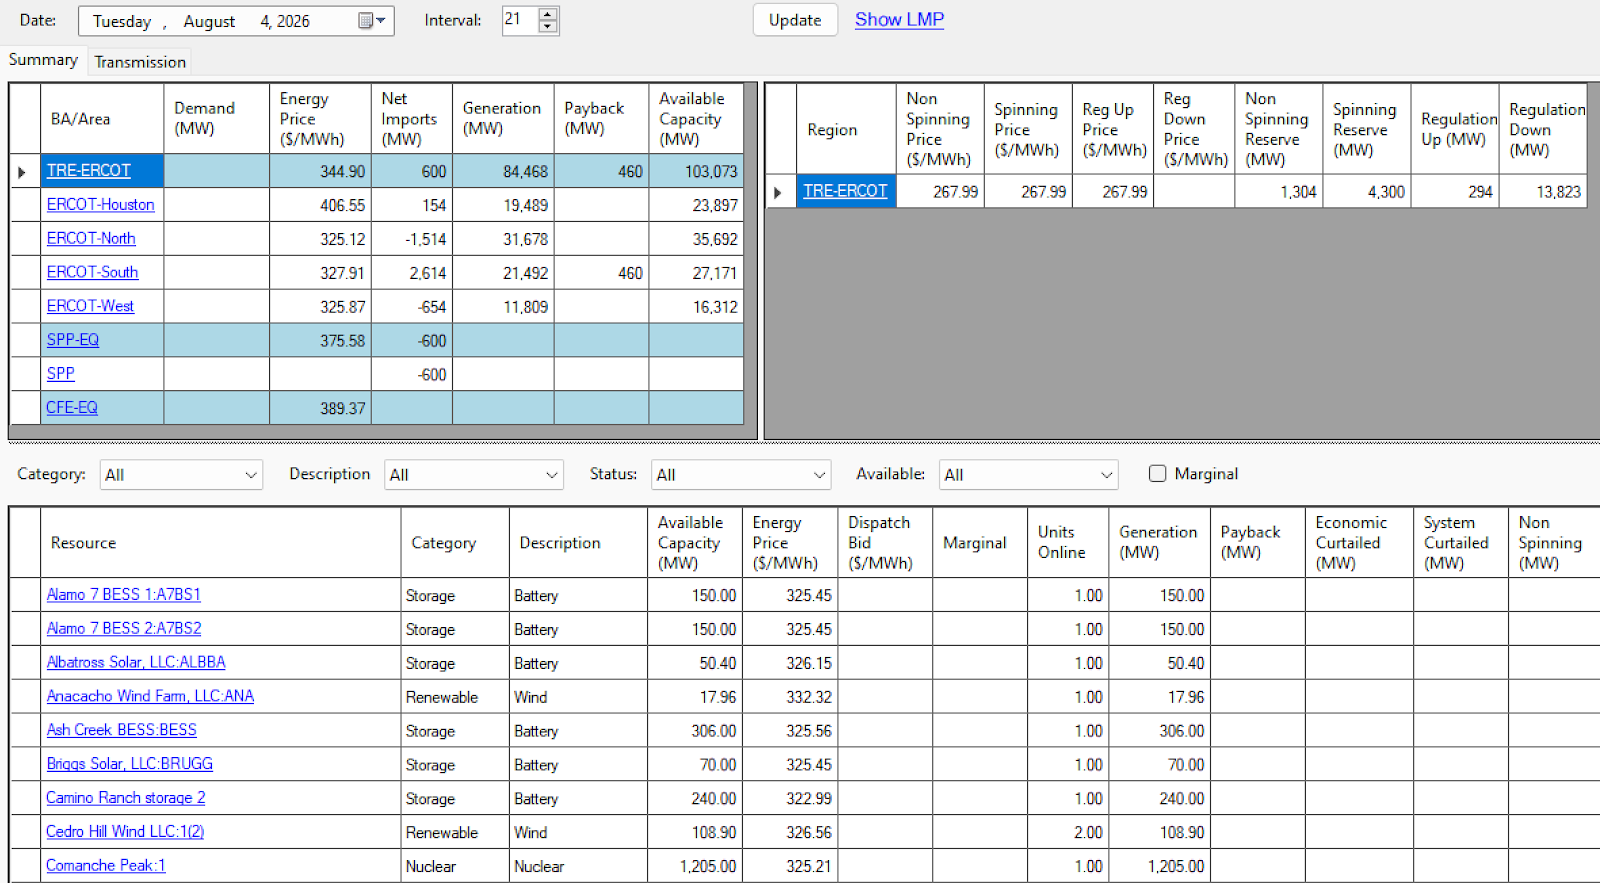
Source: Yes Energy’s EnCompass
How Can We Help You As ERCOT and CAISO Renewable Energy Increases?
Yes Energy has the tools and data to help you anticipate and prepare for changing energy demand and generation trends.
Our TESLA load forecasts enable you to make the most informed decisions possible when buying and selling in energy markets worldwide. Generated with proprietary forecasting engines, our solutions feed comprehensive weather variables and calendar information to proprietary algorithms. It’s especially valuable when you need to respond to changing weather patterns, extreme weather events, and holidays that might impact energy demand.
The grid is constantly changing, and Yes Energy’s Infrastructure Insights Dataset helps you understand points of transition. You can see where transmission and load centers – for example, industrial facilities, data centers, and bitcoin mines – are being constructed or retired across the US.
In addition, our EnCompass solution can forecast the energy and ancillary service prices for all hours of the year to understand the intervals of volatility. Individual generator output, curtailment, and shift factors are forecasted, providing valuable insight on which resources are adding to or reducing congestion. You can examine how generation from resource groups fluctuates to help identify times when operating reserves may become scarce, causing price spikes. You can also visualize transmission flows on our flow diagram, and you can identify total congestion cost and shadow prices to better understand the root causes that impact prices.
Want to learn more about how any or all of the tools can help you prepare for the gird of the future?

 About the author: Jason Atwood has experience in operations and engineering, generation and transmission planning, energy trading support, and market design. His work spans several energy sectors, including investor-owned utility, independent system operator, electric cooperative, and independent power producer. He is helping Yes Energy clients understand how our EnCompass solution can meet their needs.
