


Share this
by Quinn Gray
Yes Energy® has made it simpler, quicker, and more efficient to analyze real-time (RT) and day-ahead (DA) congestion by allowing you to visualize and analyze RT and DA (DART) constraints in the same window, at the same time.
Why Congestion Matters
Congestion is one of the biggest drivers of nodal power price volatility across North American power markets. Independent System Operators (ISOs) regularly publish congestion information – or more specifically, transmission constraint data – as an output of their RT and DA model runs.
Constraint data is inherently messy and complex. Constraint names differ widely between the RT and DA markets, making it hard to compare RT and DA constraints.
Understanding RT congestion and price volatility is essential and so is understanding DA congestion and price volatility. The real value, though, comes in the overlay of that information, since the opportunity and risk lie in the differences between those markets. Changes in congestion, the RT and DA constraints, drive the price differences between RT and DA markets.
You have to understand DART constraints to make informed trading decisions to make money or hedge potential risk. The ability to view transmission outage and congestion data on detailed maps and charts is part of that process. That’s why we’ve incorporated the new DART market view into the constraint summary module as part of our PowerSignals® product suite.
How You Can Use DART Constraints to Improve Your Congestion Analysis
The new DART market view is available for six ISOs: PJM, ERCOT, SPP, MISO, NYISO, and NEISO.
Some of the questions you can start to answer when working in that view include:
1. How is RT and DA congestion bias trending over time? On what days did we see the greatest divergence between RT and DA congestion?
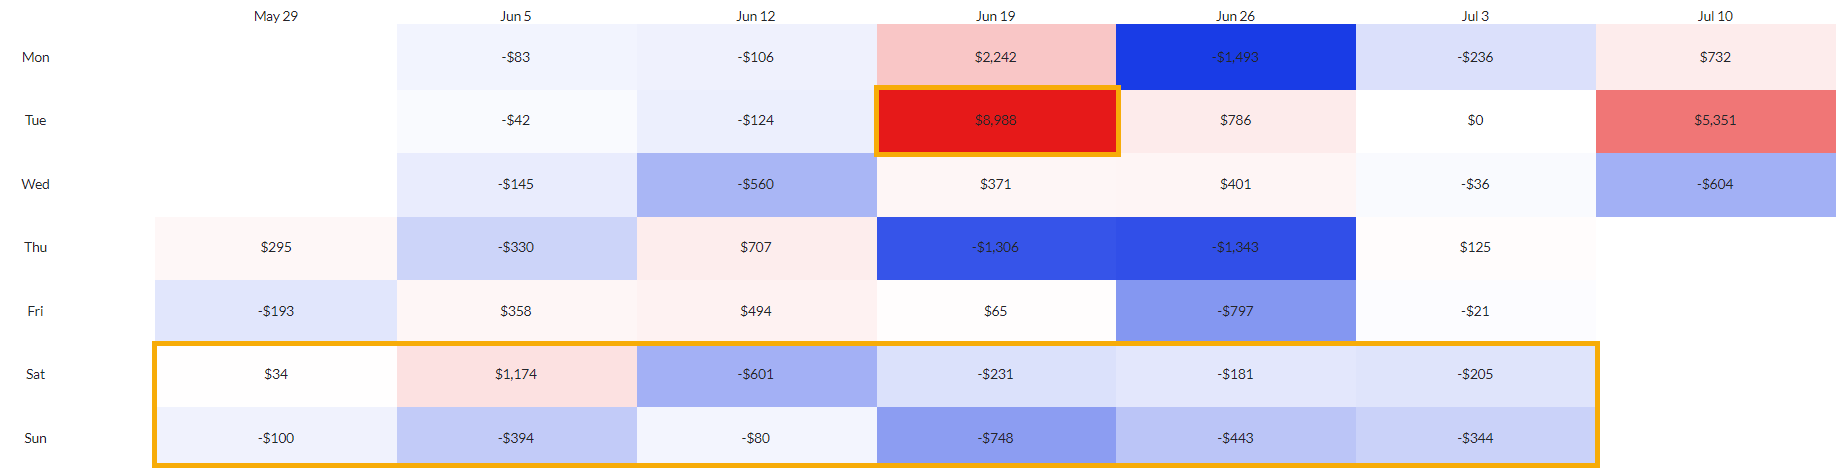
Figure 1: ERCOT from 6/1/23 - 7/12/23, rolled up to a daily aggregation. Boxes in red represent days where RT > DA congestion; boxes in blue represent days where DA > RT congestion.
DART Constraints allows you to view:
- Congestion bias trends: You can understand and analyze how the market is adapting to modeling misses by the ISO each day. For example, ERCOT was consistently over-modeling DA congestion in comparison to RT congestion nine out of 10 days between June 1, 2023, and July 12, 2023.
- Daily constraint divergence: You can identify specific days with a major disparity between the RT and DA congestion – and dig deeper into how and why the ISO was missing in either its RT or DA models and look into the contributing grid conditions on that day. For example, we can see that on June 20, 2023, RT congestion came in at $8,988 over DA congestion.
2. Where is the ISO under-modeling or over-modeling congestion?
DART Constraints allows you to:
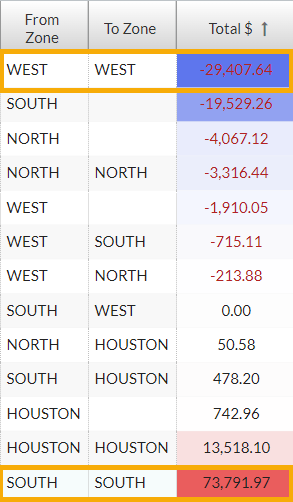 Find zone-specific arbitrage opportunities. Look at specific zones where the ISO consistently over or under-models congestion. For example, ERCOT’s WEST Zone is consistently over-forecasting DA congestion in relation to RT congestion versus ERCOT’s SOUTH Zone, where the ISO regularly is under-modeling DA congestion in relation to RT congestion.
- Monitor specific positions/assets in a single zone. Enhance your monitoring based on how the ISO forecasts congestion. For example, with an asset in ERCOT SOUTH, you should continue monitoring RT constraints that the ISO continues to miss in their DA congestion models.
Figure 2: RT vs. DA congestion aggregated by zone in ERCOT between 7/1/23 - 7/12/23. Blue boxes represent the total shadow prices where DA > RT congestion; red boxes represent RT > DA congestion in that zone.
We see a similar pattern when looking at zonal congestion on June 20, 2023, where RT congestion is much greater than DA congestion in the SOUTH zone:

3. Which RT constraints were never reported in the DA? Did this DA constraint actually show up in the RT?
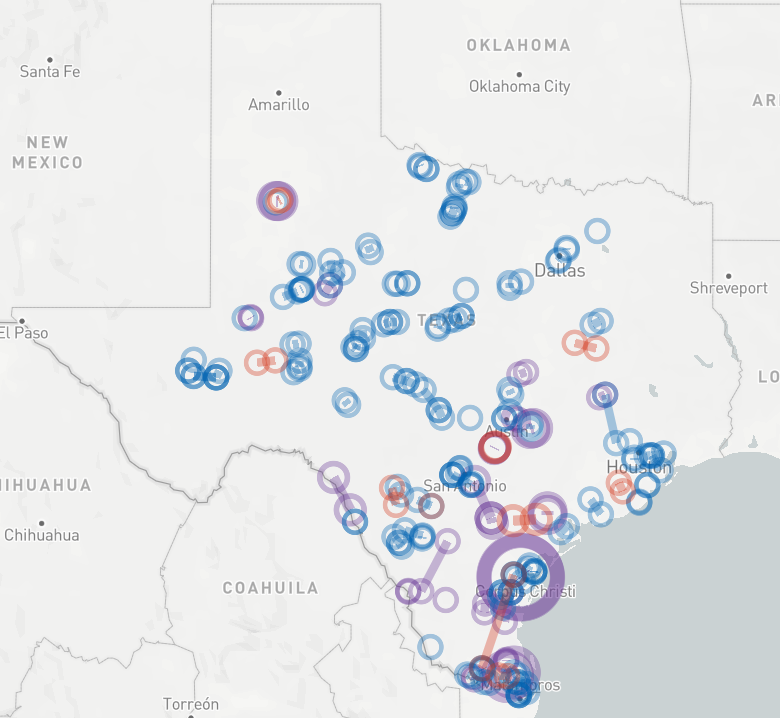
Figure 3: All RT and DA constraints on 6/20/23. RT constraints are in red; DA constraints are in blue, and DART constraints are in purple.
Using DART Constraints allows for:
- Quick market comparison. Identify constraints happening in one market but not the other for great arbitrage opportunities. For example, the ISO could continue modeling a DA constraint that never shows up in the RT (see all of the blue circles on the map).
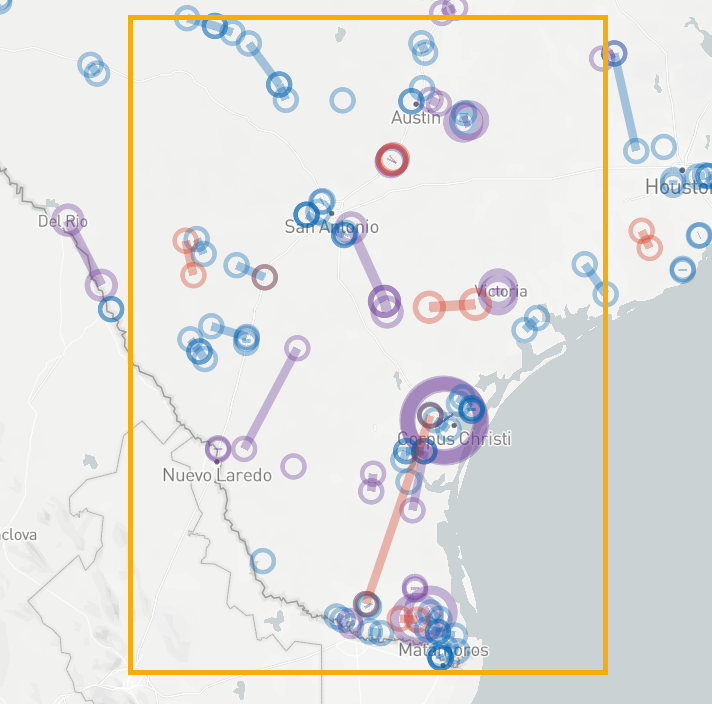
Figure 4: ERCOT SOUTH Zone on 6/20/23
Let’s zoom in further on the BURNS - RIO HONDO constraint to compare RT vs. DA shadow prices for the two weeks around the June 20, 2023, binding event.
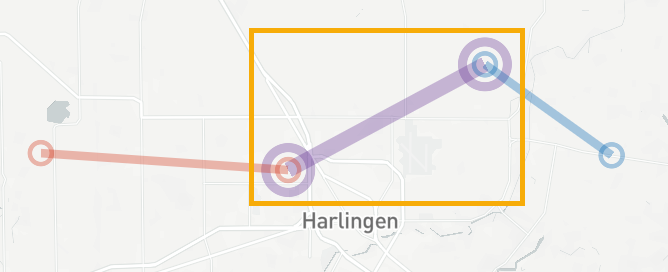
Figure 5: BURNS - RIO HONDO 138KV constraint
4. Was this constraint as active in the RT as it was in the DA? Was the strength of the constraint as large in the RT as in the DA?
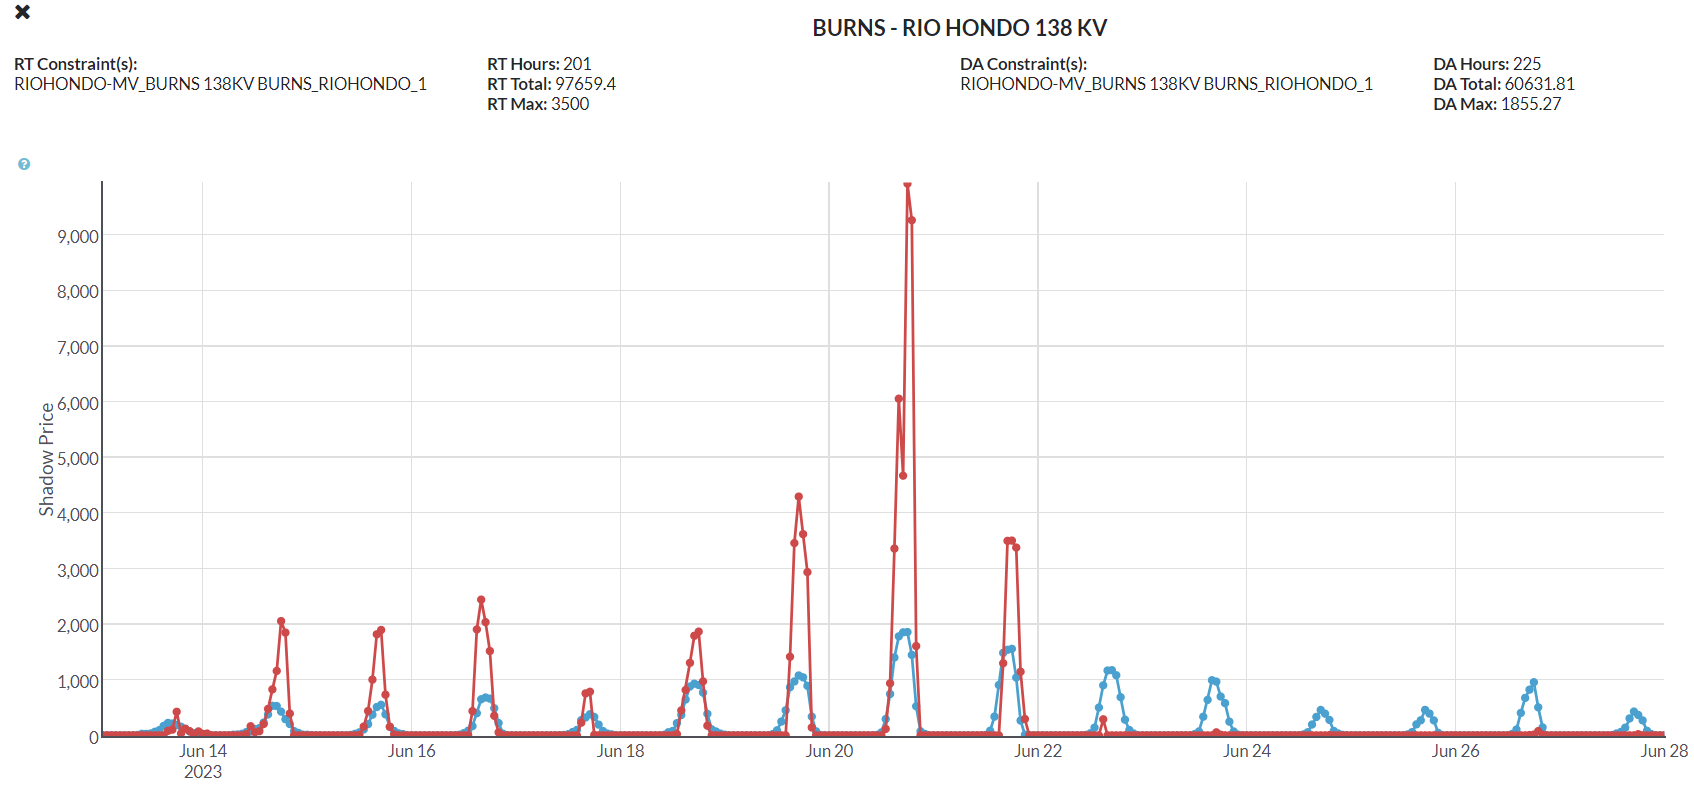
Figure 6: Shadow price time series of the RT constraint shadow prices (red) vs. DA constraint shadow prices (blue) for BURNS - RIO HONDO 138 KV on 6/20/23.
When we work with DART constraints, we benefit from:
- Faster Market Analysis. You can understand patterns of behavior for specific constraint divergence. For example, we see that the BURNS - RIO HONDO 138 KV constraint was consistently coming in stronger in the RT than it was modeled in the DA from 6/13/23 - 6/23/23.
Next, let’s revisit 6/20/23. Our updated view displays:
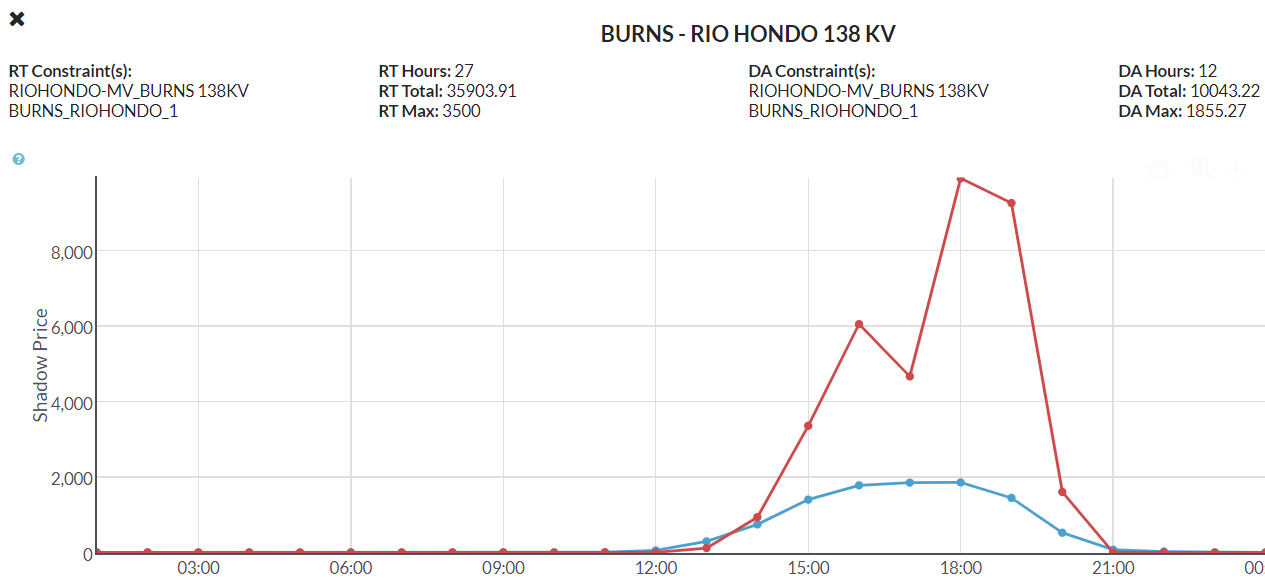
Figure 7: Shadow price time series of the RT constraint shadow prices (red) vs. DA constraint shadow prices (blue) for BURNS - RIO HONDO 138 KV on 6/20/23.
- Time Identification. You can narrow down exact times where RT and DA constraints diverge for more in-depth analysis of the grid conditions during that time. For example, the RT constraint bound for almost exactly the same amount of time on June 20, 2023, but it came in much stronger in terms of its shadow prices.
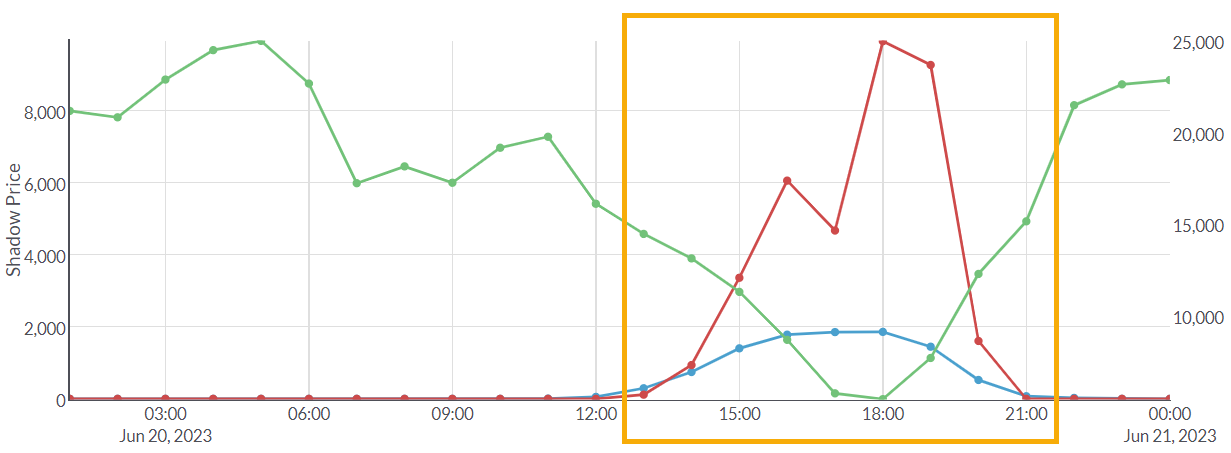
Figure 8: WIND - RT Generation - GR_South in green vs. RT shadow price (red) and DA shadow price (blue) for the BURNS - RIO HONDO 138 KV constraint.
We can employ DART constraints to identify:
- Long-Term Congestion Strategy. You can layer additional data series onto the shadow price time series to find persistent, tradeable trends. For example, in the RT Wind Generation for GR_South image on June 20, 2023, when wind generation drops below a certain level, we see the RT shadow price spike when the Burns – Rio Hondo 138 KV constraint is active. You can apply that information widely to your trading positions, hedging strategy, or dispatching decisions.
Conclusion
Yes Energy makes it easier, faster, and more efficient to navigate the complex congestion landscape across North American ISOs. We do this by providing the most comprehensive nodal power market data available and delivering it as an integrated, complete data set with flexible options to ingest and analyze your data. This makes it quicker and easier for traders, power companies, and asset managers and developers to understand market developments and make the most informed decisions.
That’s why we’ve made it simpler, faster, and more efficient to visualize and analyze DART constraints in the same window, at the same time, increasing visibility into the differences between RT and DA congestion that affect your profit and loss (PNL) and trading strategy.
Want to see how it works?

When you’re making multi-million dollar decisions amid complex, rapidly changing nodal power markets, you need a data specialist.
Learn how Yes Energy helps customers Win the Day Ahead™ with Better Data, Better Delivery, and Better Direction.
About the author: Quinn Gray is the Senior Product Manager for Yes Energy's flagship product, PowerSignals. He loves building on Yes Energy’s best-in-class visual analytics tools to save customers both time and money. Outside of work, Quinn is an avid cook, adventurer and storyteller.
