


Building a model to forecast the likelihood that ERCOT’s System Lambda will spike for each hour of the next day.
Enter Myst. We provide tools for power market participants to build highly accurate near-term forecasts. In this blog, we’ll show how you can use the Myst Platform to predict spikes in ERCOT’s Real Time Market System Lambda price — the energy price not including congestion and price adders. Defining a spike as any price over $50/MWh in this example, we will show how to forecast the probability of a real-time price spike occurring in any given hour tomorrow at the day-ahead horizon. This would leave an asset owner enough time to make decisions about which markets to participate in.
We can frame this problem— will the price spike or not?— as a binary classification task. For classification tasks AUC (see more in the footnote). It ranges from 0 to 1, where 0.5 indicates random performance. The model we built on the Myst Platform achieves 0.88 AUC¹ on the task of predicting price spikes—a full 0.12 AUC better than if we had assumed price spikes tomorrow happened at the same time they did yesterday!
All the code used to query data, create the model, and evaluate it is available in this accompanying tutorial.
Let’s Talk Data.
The Myst Platform helps users build and deploy machine learning models to forecast time series, such as energy prices. Since a machine learning model is only as good as the data it has access to, we put a lot of thought and care into making the right data available to our users. Through our integration with our partner Yes Energy, market data across all Independent System Operators (ISOs) in the United States is accessible directly in the Myst Platform.
Through Yes Energy, we can query our time series of interest (our target), ERCOT’s System Lambda, with this simple Python snippet.
With our target data ready to go, let’s talk about the relevant model features for forecasting price spikes.
Focus on Features
At Myst, we tend to model market prices using three broad feature categories: market, weather, and time data. To be clear, many of our customers are market experts, and our software provides them the flexibility to experiment with other features — whether other data from our third-party data providers or their own. Let’s dive into these three feature categories a bit more:
1. Market Data. This feature category includes price data, load and renewable generation, and system operating conditions. We know that recent prices are a very strong predictor of future prices. For our price spike model, we’ll use the Real Time Market (RTM) System Lambda prices from yesterday (a so-called “lagged” feature) as well as the System Lambda from the Day Ahead Market (DAM) run for the current day.
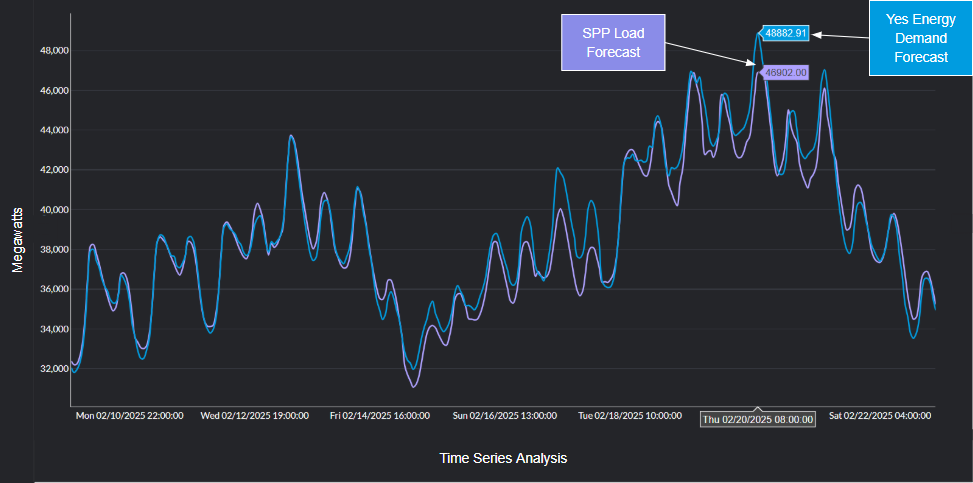
Next, we’ll add load and renewable generation forecasts for the whole system and at the zonal level, also queried through Yes Energy. These features reflect simple supply and demand effects. As load (demand) increases, price also tends to increase. Likewise for generation, the more renewable (read: “cheap”) generation that is available on the market, the lower prices tend to be.
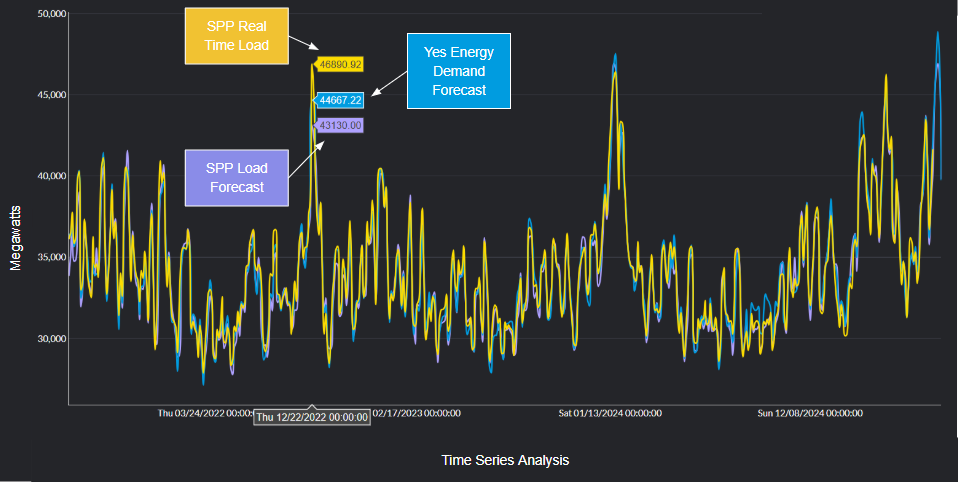
When we deal with forecasted features, we have to be cognizant of the so-called “as of time” of the forecast. That is, we need to be sure that the forecast features we use for prediction will be available as of the time that we generate our price forecasts. Additionally during backtesting, it’s best to use feature data that would have been available at the time we would have generated our forecasts, whenever possible. Luckily for us, Yes Energy provides historical forecasts that we can query by “as of time,” which Yes Energy refers to as “vintage.”
By leveraging a Myst concept known as Time Series Layering, we can transparently operate on historical forecasts at a fixed “as of time” during training and backtesting, while querying the freshest forecasts available when it’s time to make live predictions. (Check out the accompanying tutorial for more information on how to set up layered time series to accomplish this.)
To complete the supply and demand analogy, we’ll also use data representing the system’s generation capacity. As the supply (generation capacity) decreases, price also tends to increase. Specifically, we can use forecasts of the generation capacity provided by ERCOT, as well as recent past conditions such as yesterday’s real-time online reserves.
2. Weather. In the Myst Platform, we offer weather data from Atmospheric G2, formerly known as The Weather Company. Atmospheric G2 offers temperature, wind speed, and cloud coverage, among other properties, for all the Meteorological Terminal Air Report (METAR) stations in the United States. We find that these weather forecasts can provide relevant information about load, wind, and solar generation.
In the snippet below, we pull weather features for a few METAR stations across Texas.
Atmospheric G2 does not currently offer historical forecasts for every past hour, so we’re unable to use them for backtesting as we did with the load and renewable generation forecasts from Yes Energy. Instead, we will use historical weather actuals to train and evaluate the model, and forecasts of future timestamps when predicting. The recipe above handles the nuances of layering historical actuals and future forecasts so that you can operate on a single time series that uses both data sources where appropriate.
3. Time. Last but not least, we’ll also include time features. Features like “hour of day” and “day of year” can help correlate price spikes to periodic changes in load throughout the day, week, and year. These are meaningful data points because, for example, price spikes often happen in the late afternoon and in the hot summer months when load is at its highest.
Specifying Your Model
Now that the input data is selected, let’s talk about the model.
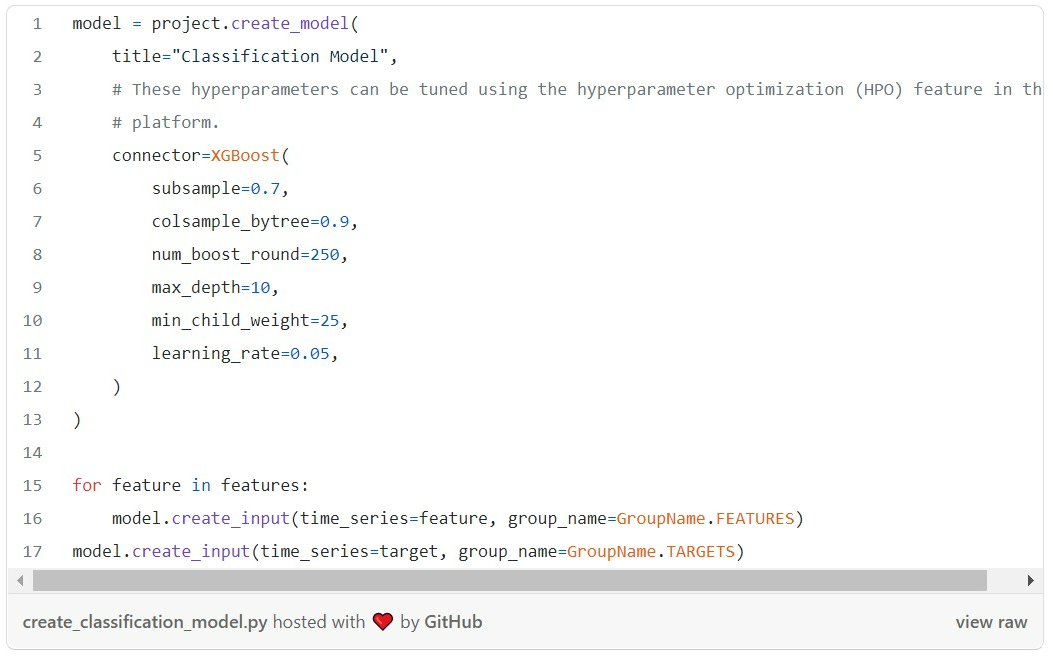
The Myst Platform provides a library of models, including industry standard approaches for baselines and production quality models. We use gradient boosted decision trees, specifically XGBoost, for this task. The model configurations offer the full flexibility of the underlying libraries, so you can experiment with different approaches, even in the same project. For example, in the accompanying tutorial, we add a regression model, in addition to this classification model, by simply changing the objective function to see if predicting spikes this way would yield better results.
Time for Backtesting
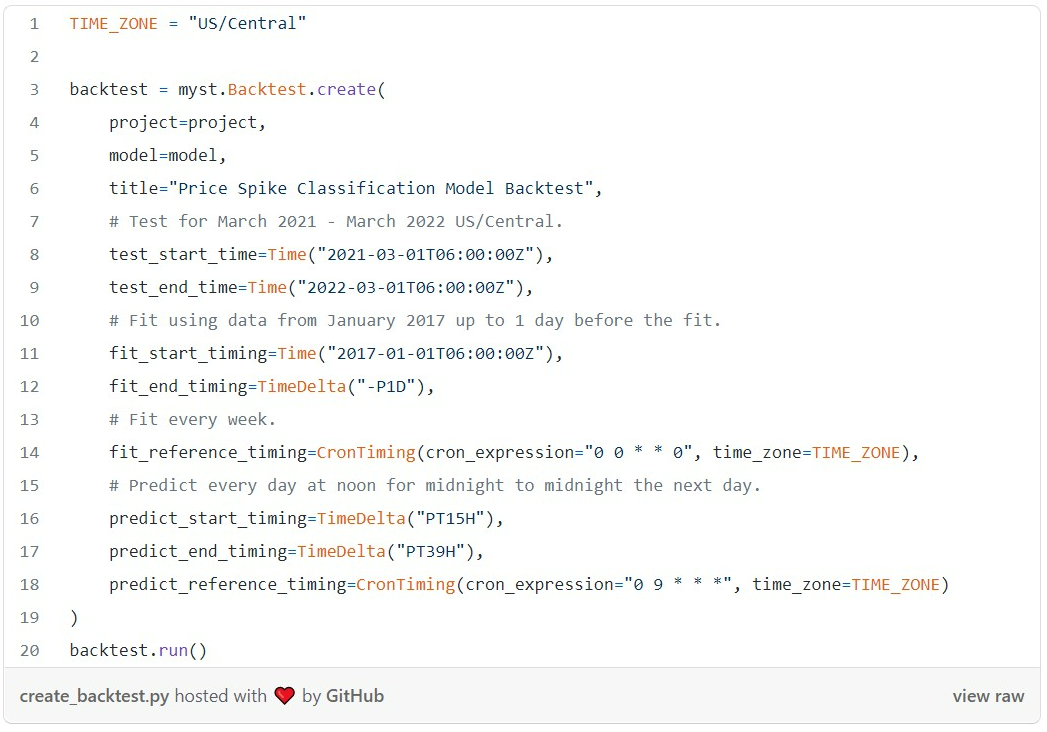
With our forecasting model set up, we can run backtests on the model to evaluate how well the model would have done in the past. Myst provides walk-forward cross-validation, allowing users to simulate regularly scheduled modeled fits and predictions—mimicking as closely as possible what would have happened in reality, without data leakage.
The following backtest configuration will train on data starting from 2017. It simulates predicting daily at 09:00 for midnight to midnight the next day and weekly model refitting.
Once the backtest is finished, the results are ready to view on the Myst Platform’s Web Application.
The predictions and actuals for the backtest period are also available to download from the platform, so we may visualize the forecasts as well as compare the forecasts with other baselines.
In this example, we compare our forecasts for tomorrow to two simple baselines to contextualize our results:
- Today’s day-ahead System Lambda (24-hour persistence). This baseline assumes forecasts for each hour tomorrow (e.g. 2–3pm) are identical to day-ahead prices for that same hour today. This is a so-called 24-hour persistence model.
- Yesterday’s real-time System Lambda (48-hour persistence). This baseline assumes forecasts for each hour tomorrow (e.g. 2–3pm) are identical to real-time prices for that same hour yesterday. This a so-called 48-hour persistence model.
From there, we consider three common classification metrics:
- Precision: When the model predicts that the price will spike, precision indicates how often that prediction is correct.
- Recall: When the price actually spikes, recall indicates how often the model predicts the spike.
- AUC: Indicates the probability that any pair of positive and negative examples will be ranked correctly based on their probability scores (i.e., the positive example’s score will be higher than the negatives example’s score).
All metrics range from 0 to 1, and higher is better.
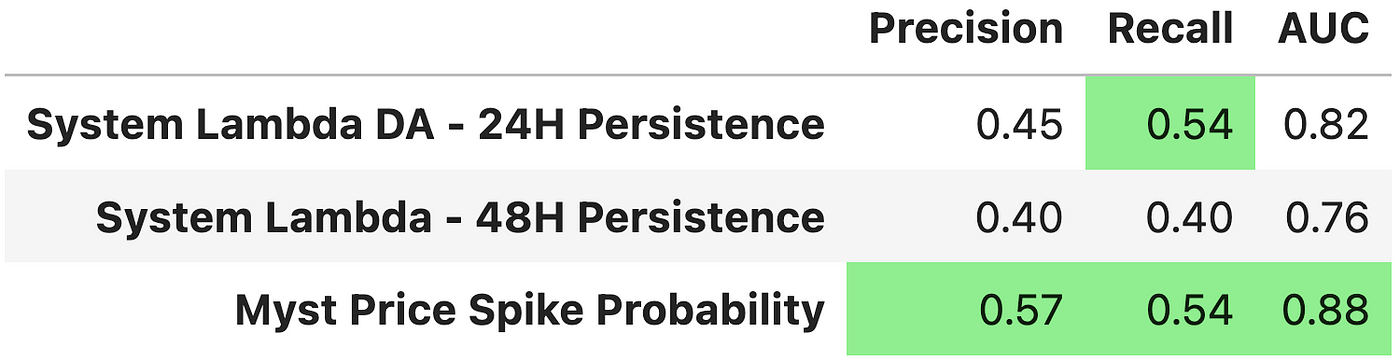
Our price spike classification model outperforms reasonable baselines!
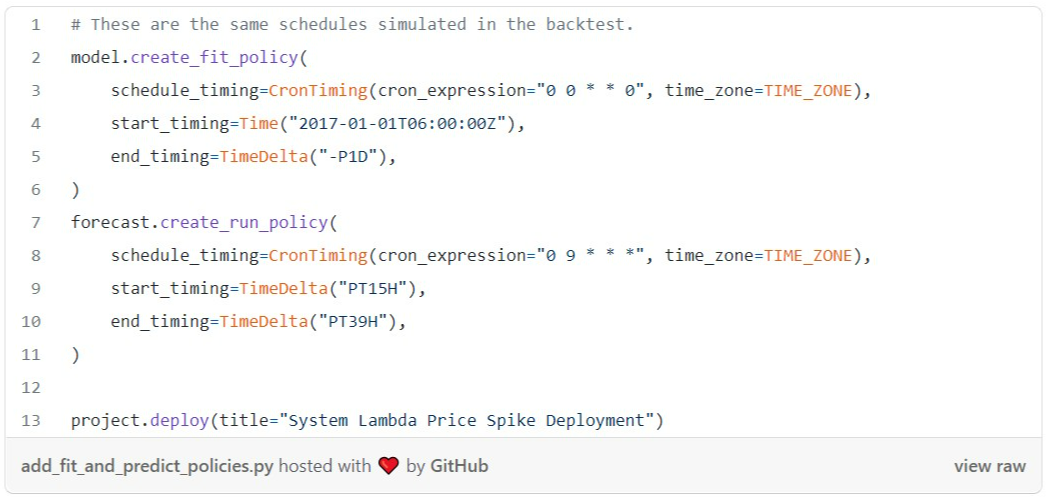
Ready, set, deploy!
So far, we’ve used the Myst Platform to create and evaluate a model for price spike forecasting. Once you have found a model that performs well, it’s easy to deploy the model to production so it generates recurring forecasts. You simply specify your prediction and model fitting schedules, run project.deploy(), and you’re off to the races.
Once the project is deployed, the Myst Platform also makes it easy to query forecast data for use in your downstream applications.
Are you ready to supercharge price forecasting?
Forecasting real-time price spikes is critical for power market participants in ERCOT — and beyond. And as we’ve just shown, Myst makes it easy for you to build a model to do exactly that.
By leveraging our platform to run a full, streamlined ML workflow — from data ingestion and model creation, to evaluation and deployment — you can create accurate forecasts with minimal overhead, while gaining invaluable insights that boost your financial profile, drive sustainability goals, and help you better serve your customers. (Existing Myst users, the code for this tutorial is available.)
To learn how the power of Yes Energy ISO data and Myst AI's platform can help you forecast real-time price spikes, reach out.

¹AUC, or Area Under the Receiver Operator Characteristic Curve, is a common metric for classification tasks, like when you’re trying to predict whether a future event — such as a price spike of $50/MWh or greater — will happen, yes or no. Its value ranges from 0 to 1. An AUC of 0.5 is the same as random chance; your forecast was no better or worse than a coin toss at predicting the event. An AUC of 0 means your forecast was always wrong, while an AUC of 1 means your forecast was always right.
