


Share this
Yes Energy®'s partnership with Snowflake allows data analysts, data scientists, and machine learning engineers to quickly and easily analyze complex, rapidly-changing power market data to bolster their decisions.
Retrieving your power market energy data with Yes Energy on the Snowflake Marketplace allows you to easily and efficiently streamline and scale your analysis and reporting. Our vast data catalog available through Snowflake allows for near limitless, scalable cloud compute capabilities for analyzing and processing Yes Energy data without any additional storage costs. Our partnership with Snowflake enables us to deliver our data on all three major data clouds (AWS, Azure, and GCP), while retaining the same end user experience.
Our partnership empowers you to leverage popular Snowflake features, such as Snowpark, native applications, and dynamic tables, all against Snowflake’s scalable compute engine. This grants you enhanced flexibility in compute choices while optimizing cost, simplifying maintenance, and enhancing security.
With Snowpark, you can write Python in Snowflake natively or connect to Python externally via the Snowflake connector. This flexibility allows you to programmatically consume comprehensive, continuously-populated data sets for pipelining, processing, machine learning, and forecasting power market data.
Best-in-Class Data Operations
Better data enables you to make better decisions. At Yes Energy, we constantly monitor and update our data, then clean and standardize it for ease of use. For example, we handle common time series data processing, including time zone standardization, interval beginning/endings, and daylight saving time so you don’t have to (Figure 1). This allows you to quickly and easily generate a clean data frame for further data processing and analysis.
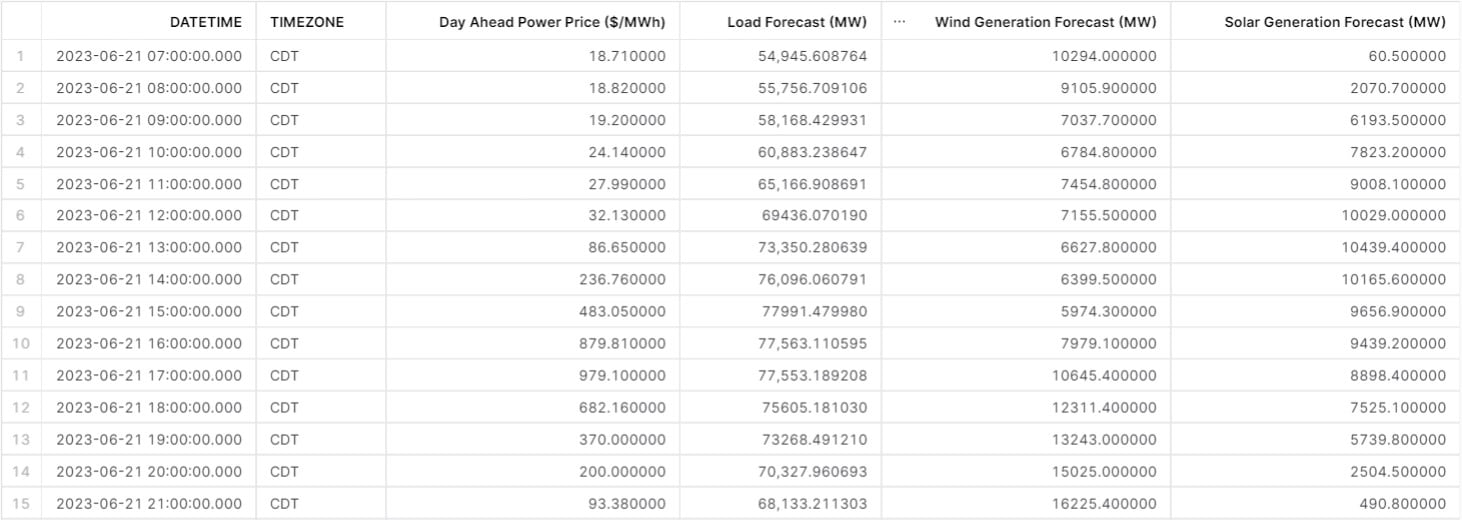
Figure 1. Sample standardized time series energy market data set easily retrieved with Yes Energy data on Snowflake. Power prices, energy demand (load), and generation data series are common and important data types for making decisions in power markets.
Yes Energy also tracks and implements all data source changes, including changes in independent system operator (ISO) reporting systems. We even have a team dedicated to monitoring the power markets and resolving the 200,000 ISO data reporting issues each year. That way, if an ISO is changing report formats, changing website links, or failing to report data, you’ll be the first to know.
As Reza Haidari, global head of power, gas, coal, carbon, and energy transition at LSEG Data and Analytics, said, “Initially, we did attempt to collect the ISO data ourselves. I concluded that because of the changing needs of our customers, the dynamically evolving and complex data sets within the power markets, we would be better served by partnering with [Yes Energy], a company that specializes in ISO source data. … Both we and our customers benefit from their reliability, accuracy, timeliness, and ongoing maintenance of ISO pricing data.”
Once you’ve quickly generated query-ready data, you can do further analysis, such as creating visualizations that summarize energy market trends with up-to-date, near real-time data. For example, you can visualize how real-time load and generation are coming in against their forecasted values (Figure 2). By visualizing market trends as well as how energy demand and generation are affecting the electricity market and North American energy prices, you can choose when to buy or sell energy, charge your electric vehicle, turn on air-conditioning, mine for bitcoin, etc.
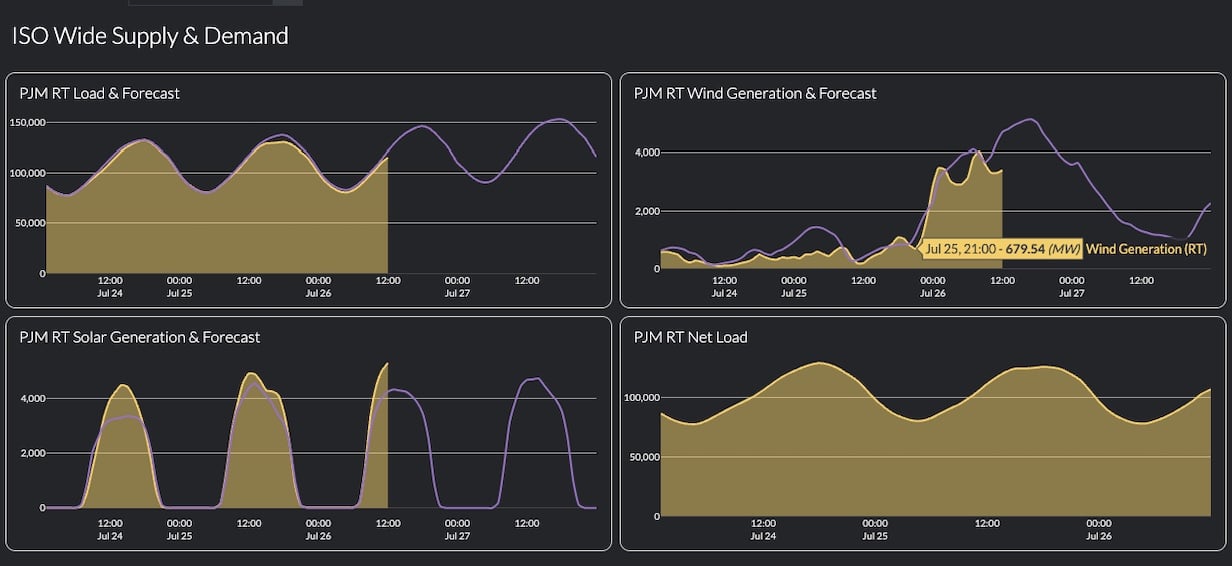
Figure 2. ISO supply and demand forecast and real-time trends that shape the price of wholesale electricity in North America
Create Your Own Model
With Yes Energy’s data, you can do modeling and analysis to make stronger decisions, whether you’re doing asset development and site planning, trading (virtually or physically), mining bitcoin, or navigating commercial or industrial manufacturing. Once you’ve generated your data set, you can create your own model to clarify your next steps, whether that’s running an onsite generator instead of pulling power from the grid, buying or selling energy, building or investing in an asset, or turning down the lights.
The availability of new modeling tools in Snowflake make it easier than ever to create your own models natively in Snowflake. You can model using common machine learning tools in Snowpark such as sklearn and the new Snowflake FORECAST services to create models of energy market variables and compare them to forecast models provided by Yes Energy partners. Yes Energy offers a free GitHub code repository with machine learning examples on Snowflake with Snowpark and more to get you started.
Free Up Your Resources
Yes Energy collects, cleans, and standardizes more than 750,000 data files and more than 110,000,000 rows of new data from public, partner, and proprietary sources every day, providing the most comprehensive North American electric power market data available. We deliver data as an integrated, complete data set with flexible options to ingest and analyze the data, allowing you to easily navigate shifting data sets with standardized data. Our data is clean, complete, accurate, and reliable, enabling you to make more effective and efficient decisions with your data sets.
Learn how Yes Energy and Snowflake can support your power market needs, and see our listings on the Snowflake Marketplace. You can also request a Yes Energy demo.

Interested in forecasting day-ahead power prices in North America? Check out our blog Unlocking Insights: Forecasting Day-Ahead Power Prices in North America with Snowpark for Python.
 About the author: Sam Lockshin is the product manager of the data products at Yes Energy. He has a passion for programmatically delivering Yes Energy’s high-quality power market data catalog to customers so they can achieve their business goals. You can catch him at karaoke, playing piano, or checking out the latest horror flick.
