


Share this
A major arctic blast will bring cold temperatures to a large swath of the Central US with the coldest temperatures – and resulting peak electricity demand – expected Thursday morning. In contrast to the winter storm in mid-January, the cold air will not reach as far south; however, the most extreme temperatures will affect more of the Great Plains and Midwest regions this time around.
Additionally, the peak load hours are expected to coincide with low renewable production levels, meaning that the net load on the system could set new winter records. If that happens, the risk of market-wide energy price spikes will grow, particularly if temperatures come in even a few degrees below forecast.
Arctic Weather Across the US
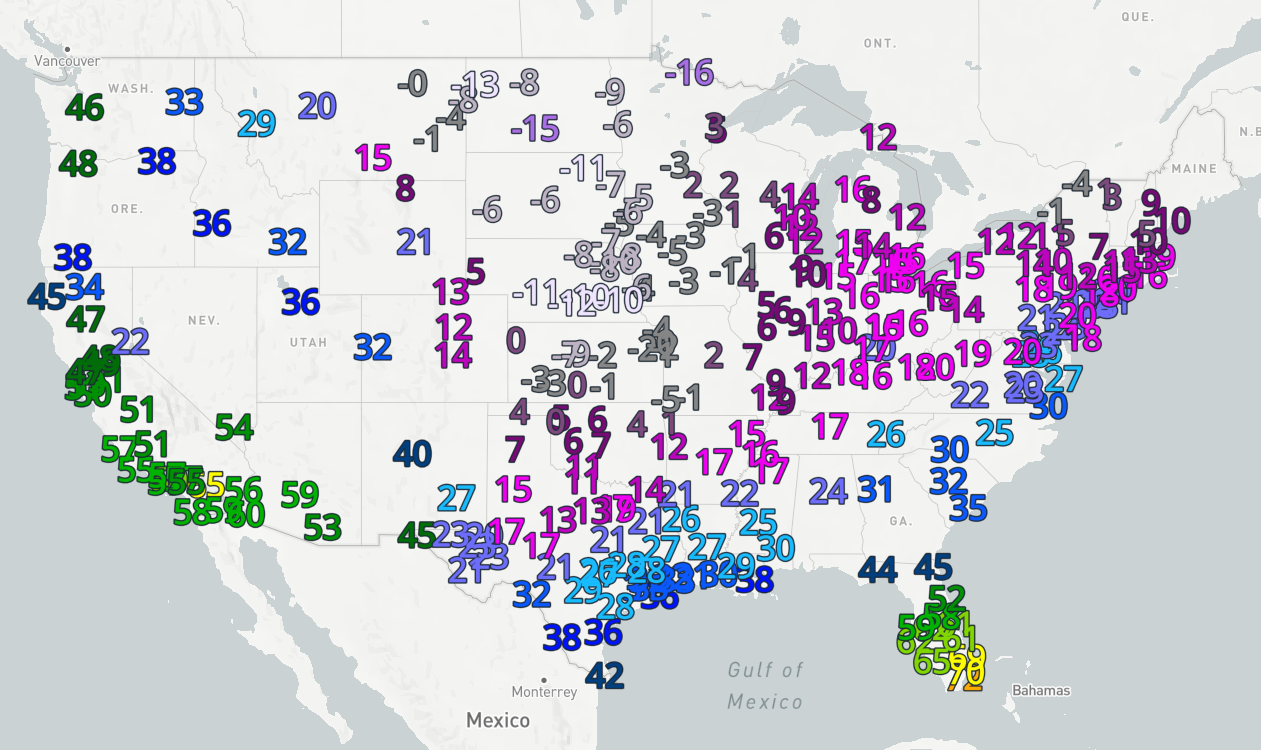
National Weather Service forecasts for the upcoming week show a major intrusion of arctic air across the Central and Eastern US. Low temperatures on Thursday are expected to range from -16 degrees Fahrenheit in Bismarck, North Dakota, and 6 degrees in Madison, Wisconsin, to 15 degrees as far south as the Dallas/Fort Worth area.
Temperature forecasts in Yes Energy’s Analytic Price Map in PowerSignals®
If we compare this event to the recent winter storm in January, a couple things stand out.
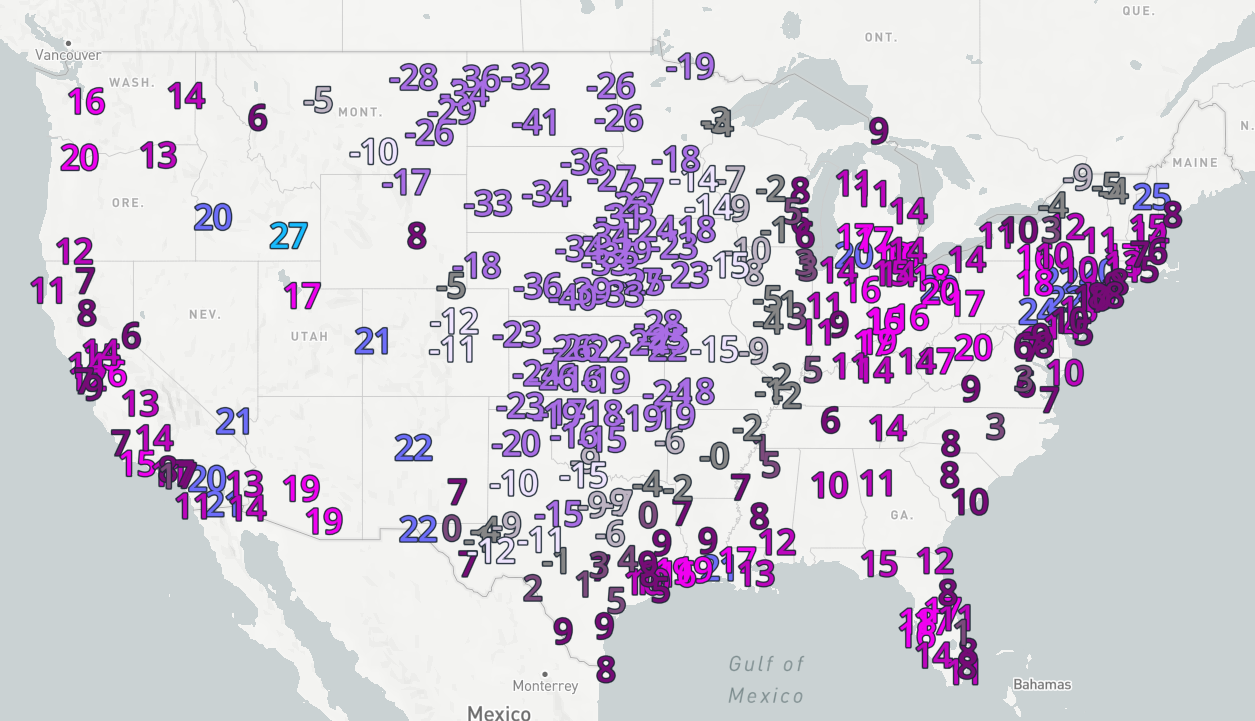
On the one hand, cold temperatures are not reaching as far south this time – Brownsville, Texas, is 7 degrees warmer with a “balmy” low of 41 degrees.
At the same time, the most extreme cold weather will affect a broader range of central states with most of the Great Plains dipping 20-30 degrees colder and Dallas, Texas, 9 degrees colder.
Comparison of temperatures in Yes Energy’s Analytic Price Map in PowerSignals
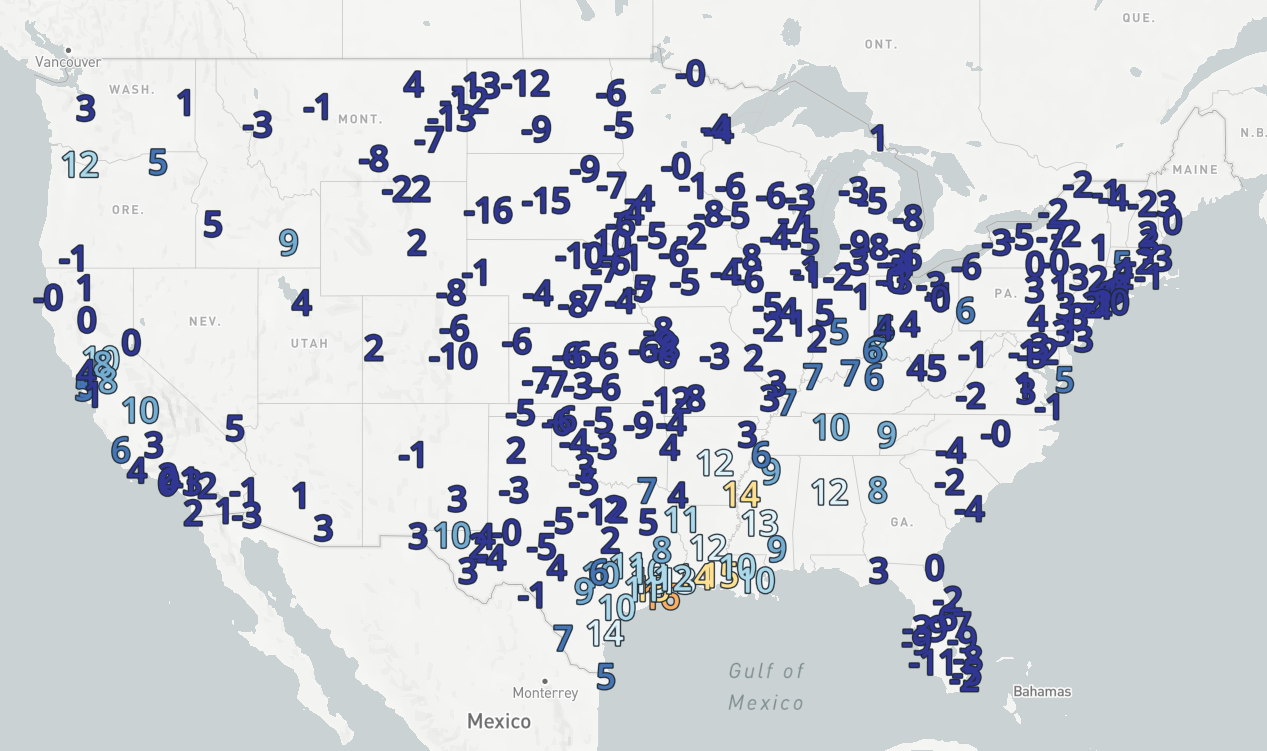
On top of the cold temperatures, wind speeds and the resulting wind power generation output will also likely be lower than they were in January.
Comparison of wind speeds in Yes Energy’s Analytic Price Map in PowerSignals
SPP Analysis and Market Conditions
Given the concentration of colder temperatures and lower wind speed in the SPPISO footprint, let’s do a deeper analysis into market conditions there.
SPP is projecting peak load on the morning of Thursday, February 20, at 46.9 GW. Yes Energy’s proprietary demand forecast for the same time period is a bit higher at 48.9 GW.
Yes Energy’s Time Series Analysis in PowerSignals
Those peak load values would top the previous hourly winter peak of 46.8 GW set on December 22, 2022, during Winter Storm Elliott.

Yes Energy’s Time Series Analysis in PowerSignals
Sometimes, when power markets experience extreme temperatures, the renewable generation output is high enough to meet the increased demand without approaching the capacity limits of dispatchable generation. But in this case, when it comes to net load (load – wind generation), the forecast looks similarly extreme.
Using the ISO load forecast for that calculation results in a net load forecast of 40.9 GW while the Yes Energy load forecast predicts a net load peak of 43.1 GW.
Yes Energy Time Series Analysis in PowerSignals
That would be almost 10% higher than the previous peak net load forecast of 39.5 GW in January 2024.
Yes Energy Time Series Analysis in PowerSignals
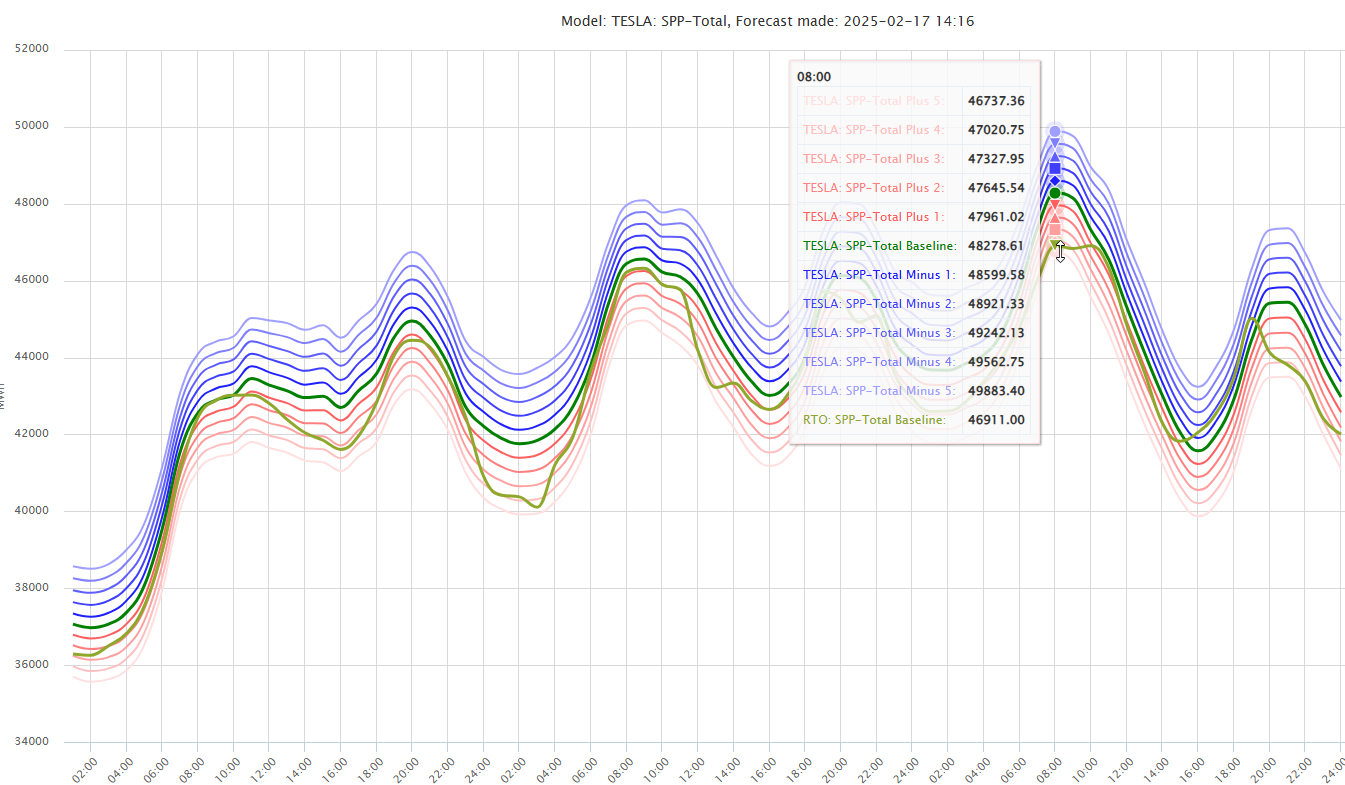
One of the biggest uncertainties for financial traders or physical operators looking to make decisions based on a load forecast is how an error in the temperature forecast might change the picture. Fortunately, Yes Energy can help model alternate scenarios where temperatures come in higher or lower than expectations.
Source: Yes Energy’s Demand Forecasts (formerly TESLA) Web Portal
As you can see, the ISO forecast in the morning peak for February 20 generally lines up with a scenario where temperatures are 5 degrees warmer than expected. And if temperatures come in just 3 degrees lower than expected, we would see the load and net-load forecasts increase by another gigawatt.
Conclusion
With the SPP footprint bracing for frigid weather this week, traders can expect not just high load but high net load systemwide. How this will translate into price volatility is still up in the air, but Yes Energy’s data and tools can help you compare forecasted conditions to previous market events for historical context and enhance your ability to model expected load conditions even if temperatures come in above or below forecast.

Yes Energy’s Demand Forecasts feed comprehensive weather variables and calendar information to proprietary algorithms. The solution is an advanced regression model that uses detailed demand and weather observation history and incorporates the latest near-term data to respond to changing weather patterns, extreme weather events, and holidays that might impact energy demand.
PowerSignals® is a dynamic solution that simplifies huge amounts of detailed power market data by transforming it into actionable insight. PowerSignals’ intuitive modules enable you to leverage high-quality data to understand market patterns and inform trading positions, hedging strategy, or dispatching decisions. Visualize ISO data such as nodes, nodal prices, transmission lines, generation and transmission outages, constraints, power plants, weather, and gas prices all on one map. For further analysis, PowerSignals allows you to easily drill down into more detailed maps, charts, and tables. Plan smarter market moves with access to historical data that dates back to the market’s inception or view real-time data within minutes of when the ISO or other primary data source publishes it.
About the author: Isaac Lichlyter was a former day-ahead power trader for eight years in CAISO, ERCOT, and PJM. While trading, he used Yes Energy tools, including Yes Energy (formerly TESLA) demand forecasts, to diagnose the drivers behind price movement in the market, and now he is helping clients understand how our solutions can meet your needs.
