


Share this
by Isaac Lichlyter on Feb 24, 2025
ERCOT is known for its congestion volatility, but during the most recent cold weather, ERCOT real-time prices on the morning of February 19 spiked to new levels.
Assuming there were no errors in the market that would trigger a price correction, locational marginal prices (LMPs) at one node averaged $28,187/MWh between 8-9 AM and held above $12,000/MWh from 5:30 a.m. until 10:05 a.m.
As is often the case with extreme events, multiple factors across supply, demand, and transmission contributed to the final result.
Let’s dive into some of the drivers that contributed to this LMP spike and whether market participants could have anticipated it beforehand.
What Happened February 19 to Real-Time Prices in ERCOT?
The highest prices in ERCOT on February 19 were concentrated at two settlement points – NF_BRP_RN and RHESS2_ESS1 – in the Round Rock area.

Source: Yes Energy’s PowerSignals Analytic Price Map
We can confirm that congestion drove these extreme prices rather than system-wide capacity shortages by looking at ERCOT’s system lamba and price adders during the same period of time.

Source: Yes Energy’s PowerSignals Time Series Analysis
As you can see, ERCOT’s system lambda – the energy component of the LMP at every location – never got above $540/MWh, and the price adders used to account for low system reserve capacity were even less impactful. This means that virtually all of the $28,000 LMP was caused by congestion.
This is noteworthy because ERCOT enforces a System-Wide Offer Cap (SWCAP), which is intended to prevent unreasonably high charges for electricity. The current SWCAP is $5,000/MWh after ERCOT lowered it from $9,000/MWh in the wake of Winter Storm Uri in 2021.
However, LMPs at individual settlement points can still exceed the SWCAP due to congestion pricing. This is not a frequent occurrence, but according to ERCOT, it can occur when there are one or more irresolvable constraints on the system.
In this case, we see that there were, in fact, multiple significant constraints binding in the Round Rock area as we can see when we add in the constraints layer to the price map.

Source: Yes Energy’s PowerSignals Analytic Price Map
In total, there were 13 constraints between 8 and 9 a.m. on February 19, which each pushed prices at the RHESS2_ESS1 settlement point up by at least $688. This led to a cumulative congestion impact of more than $26,500.

Previously, the highest real-time LMP in ERCOT was just over $12,700/MWh during Winter Storm Uri in 2021 when extreme congestion occurred simultaneously with system-wide offers hitting the previous cap of $9,000/MWh. This illustrates just how extreme the congestion this week was in comparison to any historical precedent.
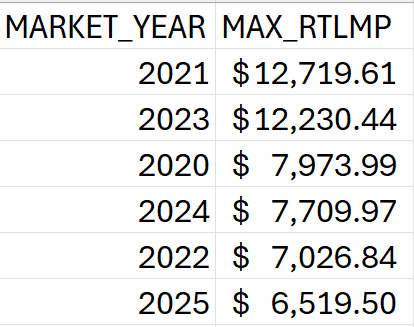
(Source: Yes Energy’s DataSignals Database in Snowflake®)
What Drove This Congestion?
So what were some of the culprits for this extreme congestion?
The most extreme congestion required a combination of multiple macro- and micro-level drivers to come together at the exact same time in a way that would have been difficult to predict. However, there is still value in understanding the factors that could lead to similar price spikes in the future.
From the demand side of the equation, a wide swath of Texas experienced temperatures well below the values forecasted in the day-ahead market. The low temperature at Camp Mabry in Austin was eight degrees colder than expected, while Waco and Mineral Wells were six to eight degrees under projections.

(Source: Yes Energy’s PowerSignals Time Series Analysis)
This resulted in a day-ahead load forecast error of over 11 GW and a day-ahead net load (load – wind – solar) forecast error of over 17 GW.

(Source: Yes Energy’s PowerSignals Time Series Analysis)
That net load forecast error of 17 GW relative to the forecast at the day-ahead market deadline is the highest we have ever seen in ERCOT and illustrates that at a macro level the conditions were right for extreme price volatility.

(Source: Yes Energy’s PowerSignals Time Series Analysis)
As the congestion only impacted two settlement points, there were almost certainly additional, more localized drivers for these extreme prices. Using power plant mapping data, we can see that the price nodes in question represent two battery storage projects – Rabbit Hill and North Fork.

(Source: Yes Energy’s PowerSignals Analytic Price Map)
This highlights a couple interesting features of the ERCOT grid. First, the Rabbit Hill Energy Storage Project has 9.9 MW of installed capacity, and that is no accident. Projects with less than 10 MW of installed capacity have been able to streamline the interconnection queue process and get to market faster than larger projects. According to Yes Energy’s Infrastructure Insights database, out of 155 operating battery projects, 80 of them have a nameplate capacity between 8 and 9.9 MW.

(Source: Yes Energy’s Infrastructure Insights module)
This capacity is substantially smaller than typical generation projects, which means that when extreme congestion occurs, a battery may not be able to provide as much relief to the system as another generator would.
Of note, out of 181 new battery storage projects that are either under construction or in an advanced stage of development and expected to come online before the end of 2028, 141 of them will have a nameplate capacity greater than 10 MW, potentially indicating a shift in approach from asset developers.

(Source: Yes Energy’s Infrastructure Insights data)
Additionally, many batteries in ERCOT originally focused on capturing revenues from the ancillary service markets rather than participating in the broader energy markets. As a result, most batteries in ERCOT are designed for short durations – typically one or two hours at the longest. This duration is ideal for ancillary service deployments, which are usually required in short bursts, and even peak shaving during periods of extreme system-wide load, but it is not well suited for responding to sustained, localized congestion like we saw during this event.
To illustrate, we can overlay the real-time market LMPs at the Rabbit Hill storage project with ERCOT’s battery discharge data.

(Source: Yes Energy’s PowerSignals Time Series Analysis)
As you can see, battery dispatch in ERCOT is typically concentrated in one to two hours during peak periods, and February 19 was no exception. There was more than 2 GW of battery storage discharging between 6 and 8 a.m., and much less in all other hours. While we won’t know the exact discharge schedules for North Fork and Rabbit Hill batteries until ERCOT releases its 60-day SCED data in April, as one-hour duration projects they would have a limited ability to alleviate a congestion spike lasting eight hours.
Of course, these batteries are not the only installed generation near Austin. However, it appears that a significant number of transmission outages in the area prevented other plants from effectively responding to the congestion pricing.

While there was no single outage driving congestion, one outage may help explain why congestion the next day was much less extreme: the Sewaju-Leande 138kV line outage. This outage was initially scheduled to continue through May 14, but it was unexpectedly cut short at 10:01 a.m. on February 19.

(Source: Yes Energy’s PowerSignals Analytic Price Map)
While congestion did not completely end at the same time as the outage, in the next ERCOT real-time price run at 10:05 a.m., prices dropped from $24,000/MWh to $9,000/MWh. This strongly indicates that the outage was a contributing factor to the unprecedented nature of the congestion.
.png?width=1660&height=842&name=ERCOT_20250219_Spike_Analysis_Page_15%20(1).png)
(Source: Yes Energy’s PowerSignals Time Series Analysis)
The other explanation for why congestion was so much less extreme on February 20 even though both load and net load reached higher levels is that there was much less deviation from the ERCOT day-ahead forecast for both variables. In fact, system-wide load actually came in almost 2.5 GW below forecast during the morning peak hours on Thursday.
.png?width=1640&height=834&name=ERCOT_20250219_Spike_Analysis_Page_16%20(1).png)
(Source: Yes Energy’s PowerSignals Time Series Analysis)
Conclusion
The combination of weather forecast error and a transmission outage deviating from its planned schedule means this price spike was not necessarily something market participants could have predicted ahead of time. And there is still a chance that ERCOT will issue price corrections if there were any errors in the dispatch process.
However, the underlying growth in small, short-duration, stand-alone storage projects is worth monitoring, especially during extreme weather events when the risk of load overperforming is higher than average. Of course, being able to quickly identify these drivers of price volatility in Yes Energy can help traders and physical operators avoid overcorrecting with bidding that is too aggressive or too conservative on subsequent days.
Learn About PowerSignals
With PowerSignals, you can visualize Independent System Operator data such as nodes, nodal prices, transmission lines, generation and transmission outages, constraints, power plants, weather, and gas prices all on one map. Digging deeper, PowerSignals allows you to easily drill down into more detailed maps, charts, and tables.
Want to see how it all works?

About the author: Isaac Lichlyter was a former day-ahead power trader for eight years in CAISO, ERCOT, and PJM. While trading, he used Yes Energy tools, including TESLA load forecasts, to diagnose the drivers behind price movement in the market, and now he is helping clients understand how our solutions can meet your needs
