Share this
by Jack Farley
When generators commit 100% of their capacity to day-ahead (DA) energy or ancillary service (AS) products, they forfeit the margin opportunity from real-time (RT) prices spikes. Conversely, when generators reserve capacity for the RT market they run the risk that RT prices clear at a lower level than DA prices. This price uncertainty is the key challenge in determining the revenue –maximizing unit commitment – do you hold back capacity or commit it all to DA?
Since 2011, annual average ERCOT DA on peak prices have been higher than annual average RT on peak prices. Further, since the significant increase in NSRS procurement (an increase from ~1,500 MW to ~5,000 MW, implemented in June 2021) the DA on-peak average price has cleared $6.77/MWh higher than RT (on peak). This increased NSRS procurement pulls dispatchable capacity from the DA energy stack, which steepens the DA supply curve and can be expected to result in increased prices at a given level of demand. Further, an increase in NSRS procurement also affects the RT supply curve by shifting NSRS capacity to the end of the RT energy stack, as these resources typically participate as “off-line” NSRS capacity and will only get deployed by ERCOT for emergencies.
At first it may appear that the “easy” decision is to commit 100% of your capacity to the DA market. However, 5x16 RT prices cleared above DA on ~25% of all weekdays and cleared more than $10/MWh above 5x16 DA on ~10% of all weekdays (based on June 1 to December 20, 2021).
-1.png)
.PNG)
A $10/MWh premium on a 500 MW generator represents $80k of incremental margin for a single day – this additional margin has been available on 1 out of every 10 days in ERCOT since June. RT price volatility has been steadily increasing due to secular trends, such as:
-
Greater real-time net load variability due to higher wind and solar penetration
-
Higher net load forecast errors from day-ahead to real-time due to load, wind, and solar variability
-
Larger Ancillary Service procurement volumes, which reduces dispatchable capacity available for DA energy supply and constrains RT participation and…
-
Chunkier thermal outages in spring and fall as the fleet ages.
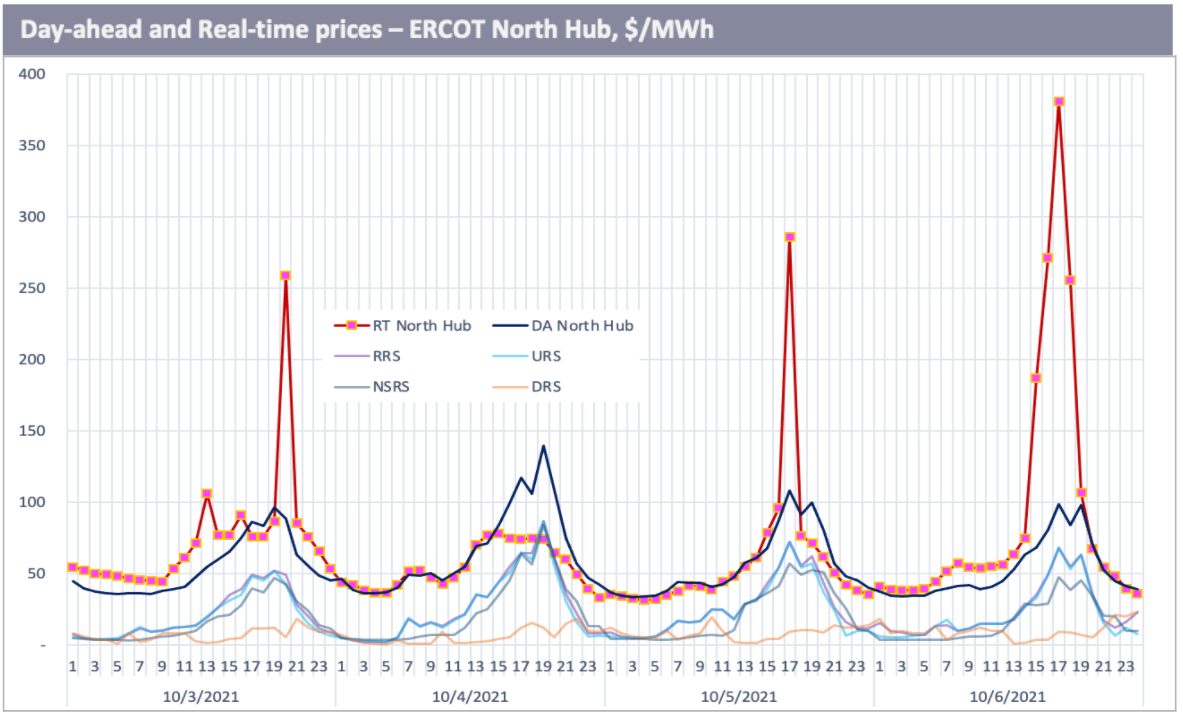
Many factors, or a combination of factors, can lead to RT price spikes. This blog post will look at a RT price spike on October 6, 2021 and point out two leading indicators: 1) the DA net load forecast, and 2) the trends in dispatchable unit commitment relative to realized/expected net loads. Prior to the DA offer deadline (9:00 am on the day before delivery), these two indicators made a strong case to pass on the DA market and instead participate in RT energy.
Day-Ahead Net Load Forecast Indicator
On the morning of Oct. 5, the ERCOT net load forecast for the following day pointed to a peak hour net load of ~48 GW on Oct. 6. This peak net load was only 2 GW lower than the actual peak net load on Oct. 3, when RT prices spiked to >$250/MWh and the on-peak DART spread was $(22.79)/MWh (DA on-peak price = $60.28/MWh, RT = $83.07/MWh). In addition, actual net load levels had been recently tracking a bit above the forecast - particularly during the peak hours of Oct. 4 and the morning ramp hours on Oct .5.
-1.png)
.PNG)
Furthermore, the peak net load forecast of ~48 GW was high relative to the previous 14 days.
-1.png)
.PNG)
Recent history also provided some positive indication of strong RT pricing - over the past 14 days, when peak net load was above 48 GW the RT price had cleared no lower than $75/MWh and had reached a high of $259/MWh on Oct. 3. This comparison provided some comfort that RT prices probably wouldn't be too disappointing.
.png)
.PNG)
The next question, then, was whether dispatchable unit commitment had been trending up or down, and how expected changes in online capacity might combine with expected changes in peak net load relative to Oct. 3.
Dispatchable Unit Commitment Trends
As of 9:00 am on Oct. 5 (prior to DA offer submission for Oct. 6), online dispatchable capacity, based on Live Power monitored plants, was 1.8 GW lower than on Oct. 3 and 4.4 GW lower than Oct. 4 (average HE 1-9). Given this 1.8 GW decrease in unit commitment coupled with a 2 GW decrease in projected peak net load, chances were good for similar RT market tightness on Oct. 6 as on Oct. 3.
.png)
.PNG)
To get a better sense of the broader market environment, it also proved helpful to look at dispatchable capacity factors by plant. Many large nuclear, coal, and CCGT facilities had experienced lower capacity factors over the past 3 to 5 days – an indicator of unit outages or derates.
-1.png)
.PNG)
Then on Oct. 4 and 5, overnight shutdowns increased – particularly for CCGT capacity – offline capacity plus nuke and coal derates increased ~5 GW during the off-peak on Oct. 5 versus Oct. 4 (the nuclear and coal derates are implied by production levels well below maximum capacity while RT prices support materially positive variable margins).
-1.png)
.PNG)
By 9:00 AM on Oct. 5, online capacity was 1 GW lower than at 9:00 AM on Oct. 4., indicating that dispatchable capacity monitored by Live Power was trending toward slightly lower online levels. The expected reduction in online dispatchable capacity during the peak net load hour on Oct. 6 (relative to Oct. 3) could have reasonably been expected to exceed the reduction in forecasted peak net load of ~2 GW (relative to Oct. 3), so conditions for a repeat RT price spike looked very promising.
Real-Time Market Results on Oct. 6
While still uncertain at 9:00 am on Oct. 5, the actual supply/demand dynamics during peak net load hour on Oct. 6 were tight, as indicated early on by the dispatchable capacity and net load forecast indicators. Actual offline and implied coal/nuke capacity de-rates on Oct. 6 at HE 19 (when peak net load occurred) were ~3 GW lower than on Oct. 3. In addition, the actual peak net load at HE 19 on Oct. 6 reached a peak of 50 GW, 2 GW above the DA forecast, making the peak net load level equivalent to that on Oct. 3.
-1.png)
.PNG)
As a result, the RT market did spike on Oct. 6, with the highest hourly price clearing above $380/MWh and the on-peak DART spread averaging $(54.82)/MWh (on-peak DA = $60.03/MWh, RT = $114.85/MWh). RT energy delivered ~2x more revenue than DA, which for a 500 MW resource represents $439k additional margin versus DA energy sales. The incremental upside entailed little downside price risk given above-average net load forecast available prior to DA offer submission.

Live Power’s generation production and transmission flow data can support advantaged day- ahead and real-time decision making, and complement Yes Energy’s comprehensive real-time ISO, weather, FERC, and fuel data. Together, they can complete your day-ahead and real-time market view.

Jack Farley is the CEO of Live Power, who operate a proprietary network of patented sensors to measure power plant production and transmission line flows on a 1 to 5 minutes basis. The Live Power plant/line data is delivered to power market participants by Yes Energy, allowing integration with a vast array of ISO data using a powerful suite of data tools. He is also the CEO & President of Apex Compressed Air Energy Storage LLC – a company focused on developing utility-scale compressed air energy storage facilities. Previously, Mr. Farley was Senior Vice President of Cinergy Corp., (now owned by Duke Energy) where he was responsible for the Power Trading and Marketing group. Prior to joining Cinergy, he was President of the West Region at Reliant Resources (now owned by NRG Energy). He was also a consultant with McKinsey & Company, mainly focused on the energy sector. Currently, he serves on the board of directors for the Hines Global REIT and Live Power Intelligence. Mr. Farley graduated with highest honors from the University of Kentucky with a B.B.A. and received his M.B.A. with a concentration in finance and operations management from the Wharton School at the University of Pennsylvania. Prior to attending business school, he was a Captain in the U.S. Army.