


Share this
by Gaby Flores
In this Market Driver Alert, we break down a perfect storm of market conditions that led to system-wide price volatility in MISO on 5/22. We’ll walk you through how market data in Yes Energy alongside real-time generation data from our partner Live Power helped explain why prices spiked to over $2,300/MWh throughout the entire MISO footprint.
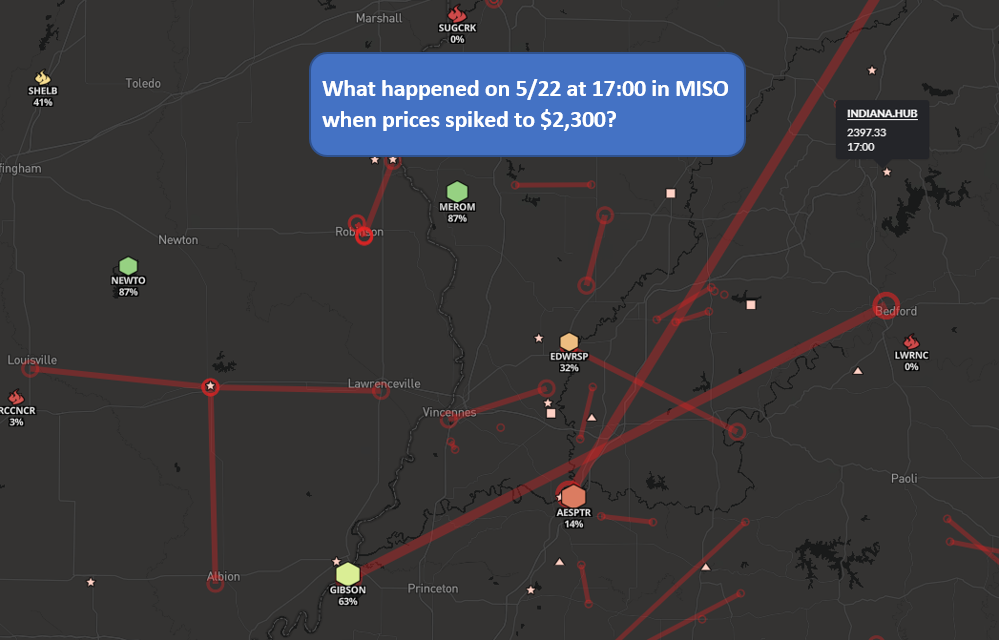

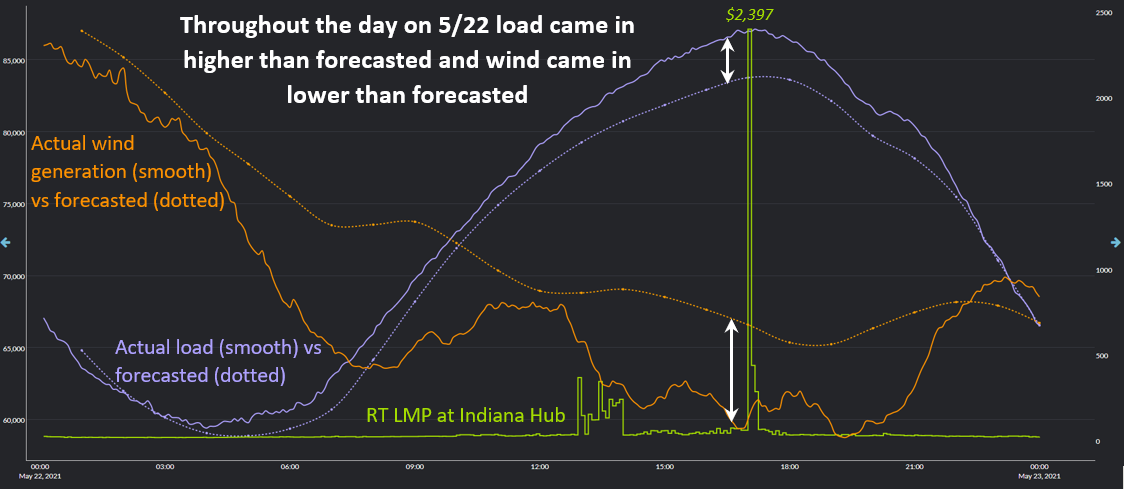
As with most market volatility, missed forecasts were partly to blame for the price spikes throughout MISO on 5/22. First, load came in consistently higher than forecasted throughout the entire day, particularly in the evening hours. This can be seen below, where the actual load in MISO is the smooth purple line and the forecasted load is the dotted purple line. Second, wind came in lower than forecasted throughout the day, which exacerbated the impact of the missed load forecast. In the chart below, actual wind generation is the smooth orange line and forecasted wind generation is the dotted orange line. The green line below is the real-time LMP at Indiana Hub, which is the most liquid hub in MISO. As you can see below, prices started to spike around 14:00 when the wind forecast error was high, but the prices weren't nearly as high as a few hours later when price nodes across the MISO footprint spiked to over $2,300. What was different about 17:00 compared to 14:00?

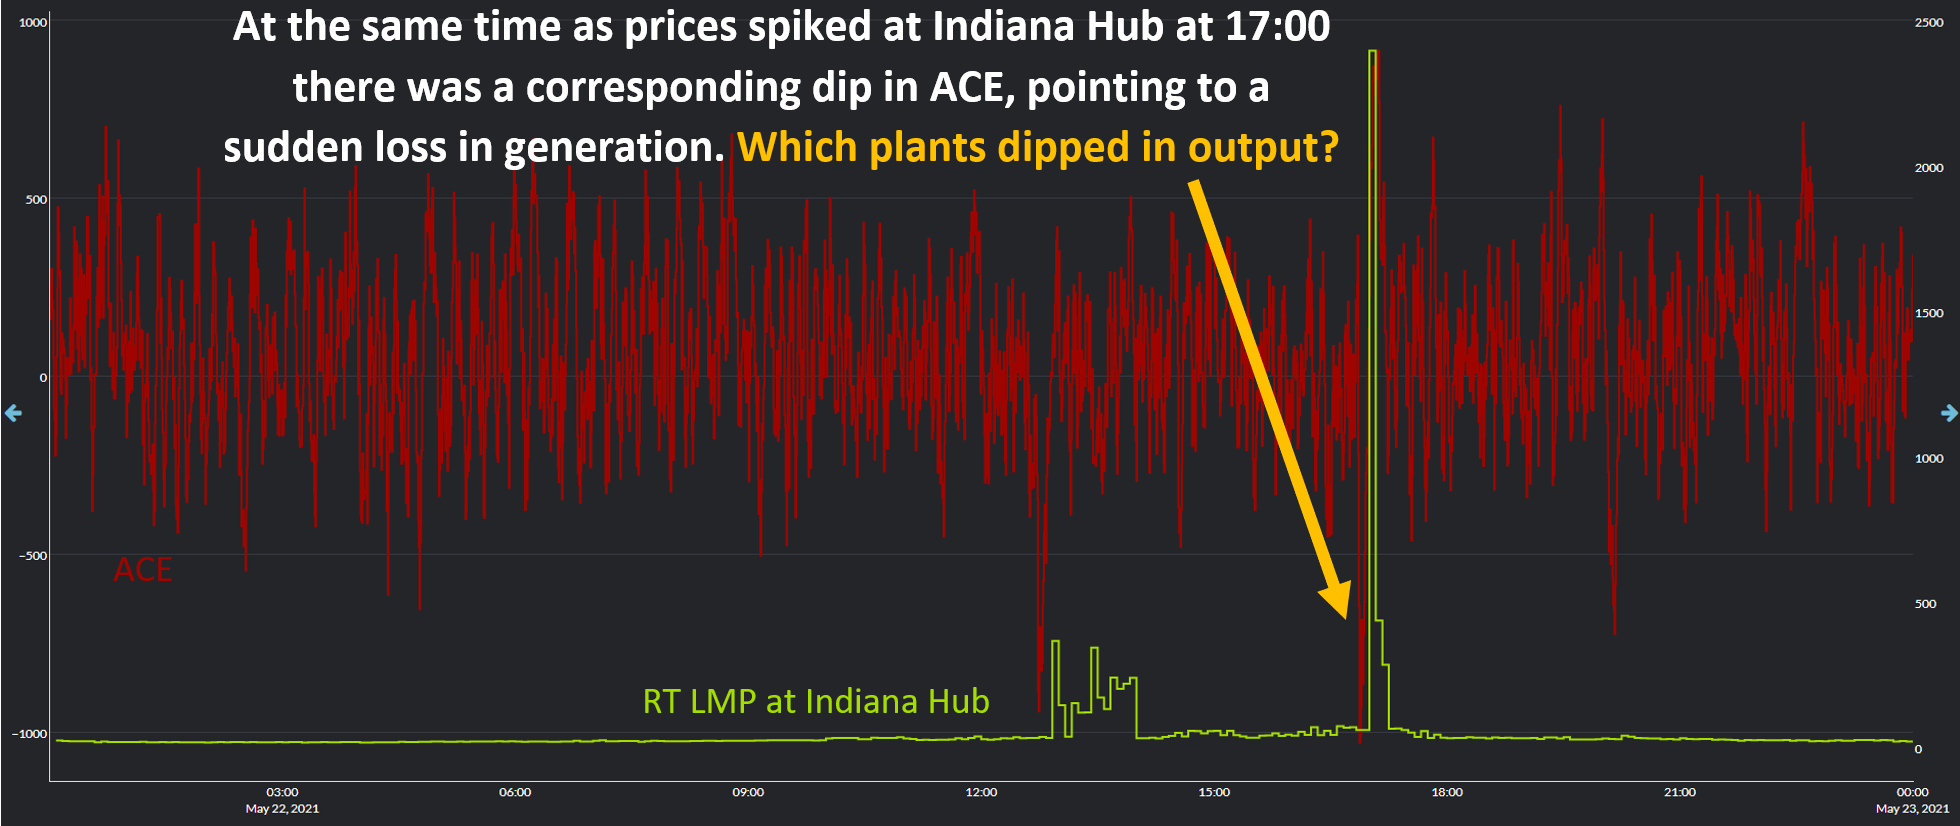
Prior to the large price spike at Indiana Hub at 17:00 we can see below that there was a sudden dip in ACE, which can be thought of as the heartbeat of the grid. For optimal grid stability, the ideal value of ACE is 0 MW. Right before prices spiked, ACE dipped to -1029 MW, which means that there was a sudden loss in generation at a time when load was higher than forecasted and supply from wind was lower than forecasted. Which plants had a sudden loss in generation?

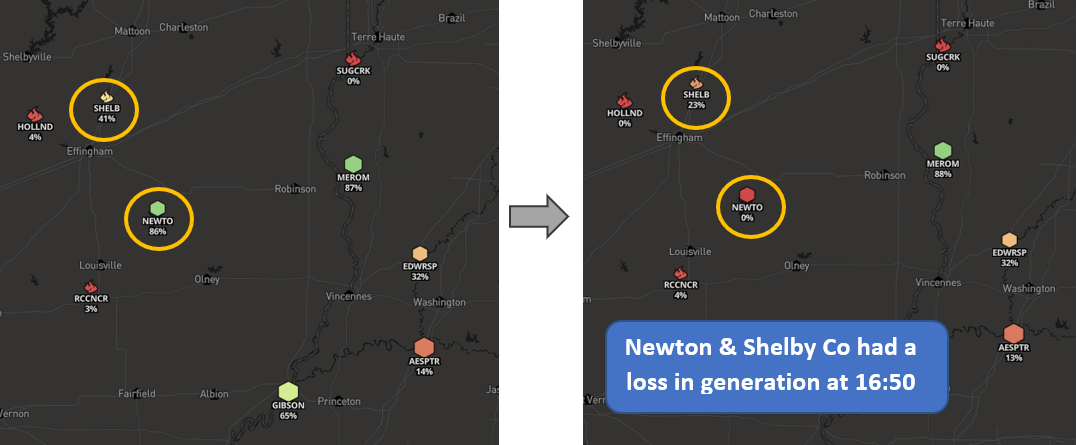
Using data from Live Power we can see which plants contributed to this sudden loss in generation because they monitor real-time generation at power plants. In the left screenshot below, which was taken shortly before the price spikes at 17:00, we can see that the Live Power monitored plants Shelby Co & Newton were operating at 41% of capacity and 86% of capacity. In the right screenshot below, which was taken shortly after the price spike at 17:00, we can see that Shelby Co dropped from 41% to 23% capacity and Newton dropped from 86% capacity to 0% capacity. Why did these plants have a sudden loss in generation? To start to explain that we can look at other market data in Yes Energy, such as plant outage data from our partner IIR Energy (IIR). On 5/22 IIR did not report any outages for these plants, meaning they likely did not go offline for a planned outage and instead went offline for some other reason.

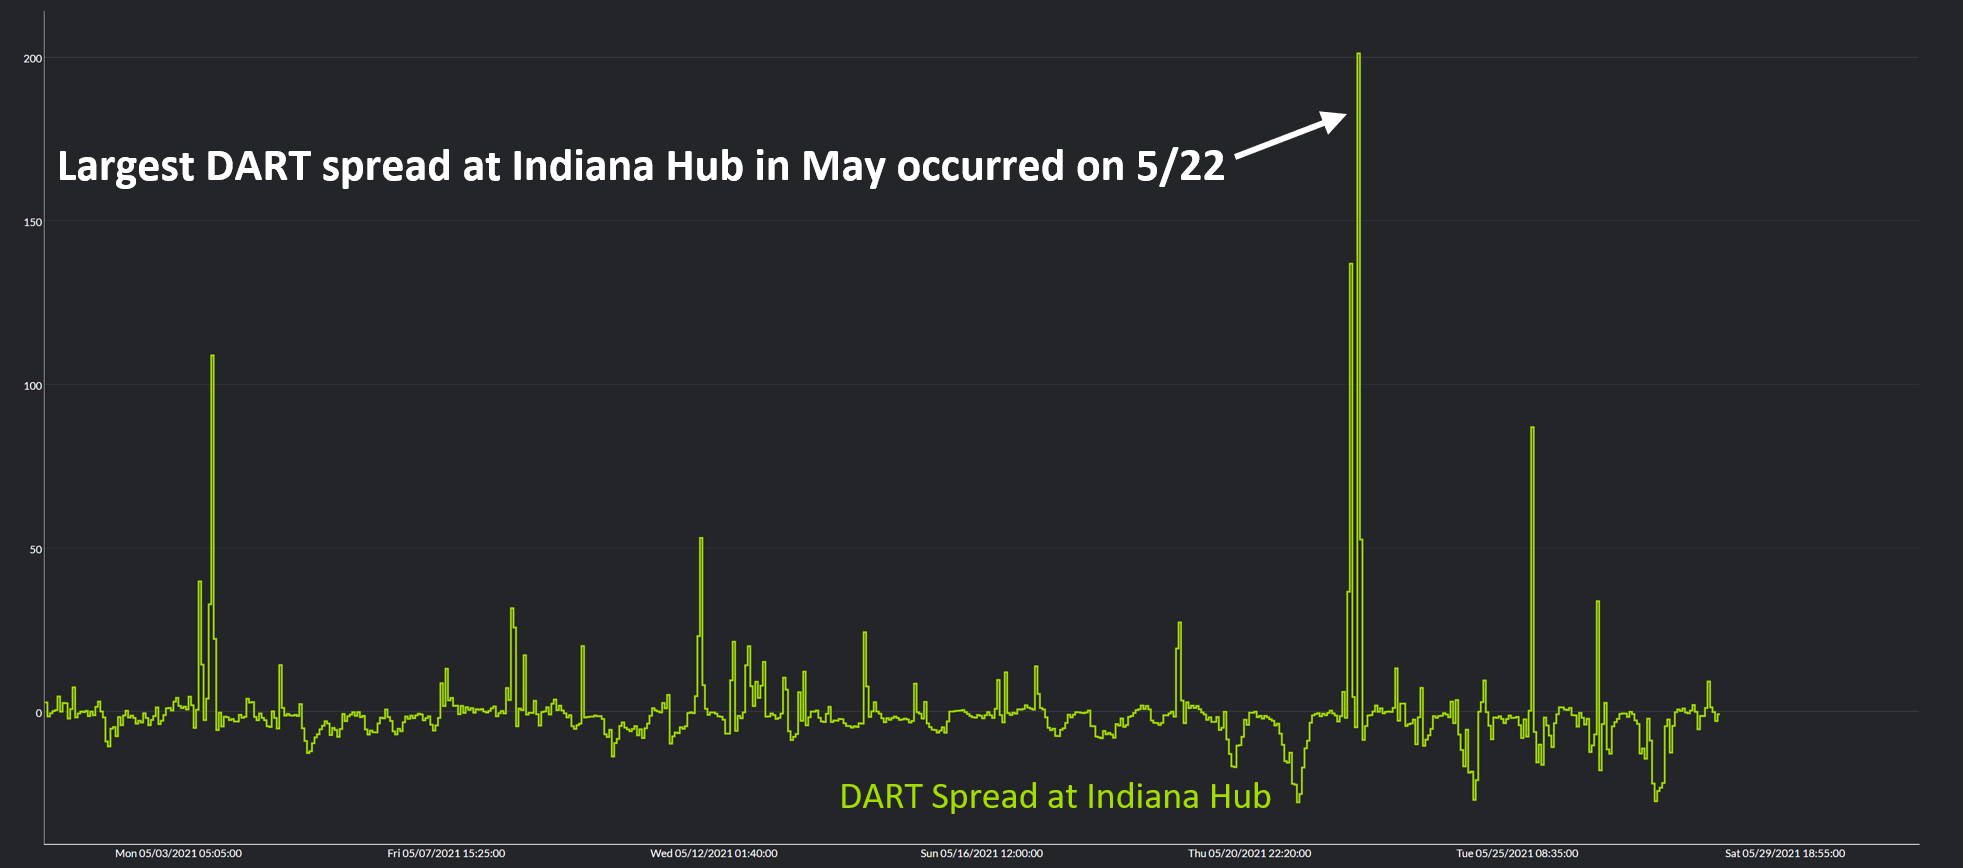
To put this day in comparison, 5/22 had the highest hourly DART spread of the entire month of May. A DART spread is the difference between the day-ahead (DA) price and the real-time (RT) price, which is important to virtual traders who are speculating between the day-ahead price and the real-time price, as well as physical traders who bid in their assets to the day-ahead and real-time markets. On 5/22 the DART spread at Indiana Hub reached $201, which means that is how much higher the real-time price came in compared to the day-ahead price. To put this in comparison another way, the average settlement price on 5/22 was $47, which is ~$20 higher than average.

In summary, the volatility in MISO on 5/22 seems to have been due to higher than forecasted load, lower than forecasted wind generation, and sudden losses in generation at key plants. Live Power data, alongside Yes Energy market data (load, wind generation, ACE, and prices) helps you unpack market events like this so that you are better prepared in the future when similar market conditions occur. You don’t want to miss out on this critical market intelligence when summer volatility hits!

