


Share this
by Gaby Flores on Nov 19, 2021
On Thursday, November 11th in SPP there were significant real-time (RT) price spikes in the morning and evening peak hours. Several factors conspired to produce price spikes over $1500, including forecast errors, ancillary service limits, scarcity pricing structures, and relatively soft day-ahead (DA) prices. We will examine these factors and ask one important question. Were there signals to provide early warning of these issues?
Timing Is Everything
In the chart below, we are viewing the DA Wind Forecast for SPP in yellow, alongside the reported RT Wind Generation for SPP (actual) in white during the peak hours on November 11th. While the two curves have similar shape and similar volumes, highlighted are the two areas we will examine today. Looking at the data around hour ending (HE) 9 and again for HE 17-18, the separation of forecast versus actual lands at around one hour. However, with both the actual and forecast wind ramps being around 3GW, the one hour offset equates to a large departure from the DA plan.
.png)
.PNG)
Compounding Forecast Errors
Given the hours where these wind production forecast errors occurred, the next piece of the puzzle is a look at ISO load data. Peak load occurred at HE 18 on the 11th - generally coincident with wind production falling below the forecast. In the below chart, we have layered the same wind series from before and added the original Load forecast (from the prior day) in blue and the RT actual system load in red. The evening peak saw load ramping in earlier, more aggressively, and ultimately higher than previously forecast. Now we are faced with a compounding effect of wind generation ramping down while load is ramping up. In the highlighted timestamp of HE 17, this equates to an unexpected demand increase of 1.5GW and a total wind production drop of 4.5GW, occurring through the forecasted evening ramp.
.png)
.PNG)
The chart below examines this same timeframe from a Net Load perspective (Load-Wind Generation). From HE 16 to 18, the original forecasted net load ramp was 1.3GW (yellow line). The actual net load for that time frame came in at 5GW (white line). The takeaway here is that load came in much higher than forecasted and wind was not able to meet as much of the demand as originally forecasted.
.png)
.PNG)
Prices and Ancillaries
The RT price spikes both during the morning and evening peak show behavior that moves the LMP outside of typical energy dispatch numbers. In the chart below, our series are the RT price at SPP South Hub in white, RT Spinning Reserve price in red and RT Regulation Up in blue. The RT ancillary prices depicted here indicate we have already arrived in the Scarcity Demand Curve (SPP data).
-1.png)
.PNG)
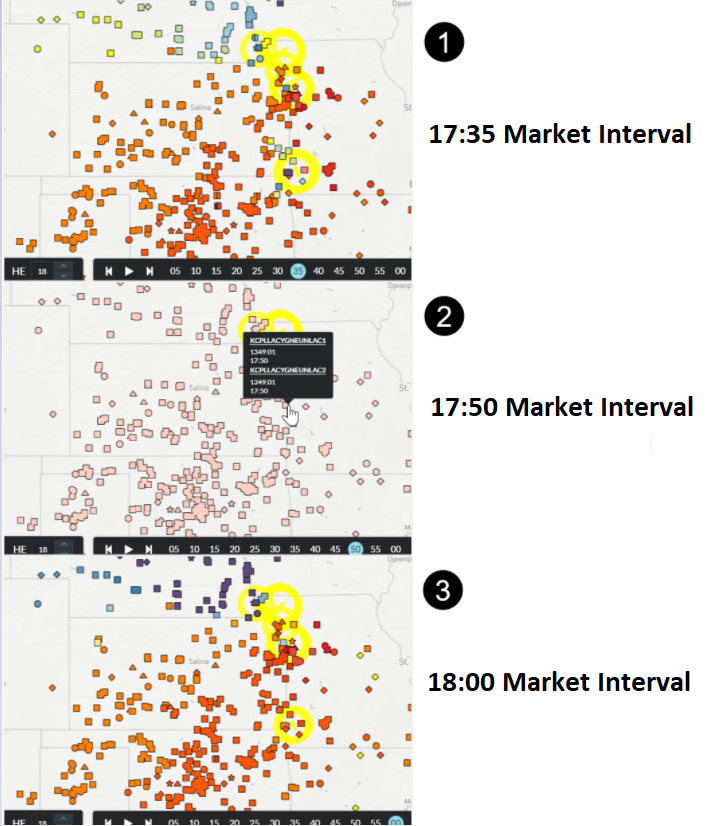
In addition to the ancillary service price activity during these intervals, we also need to look at both Scarcity Pricing and Violation Relaxation Limits (VRL) processes (Integrated Marketplace Protocols sections 4.1.4-4.1.5). The ISO has effectively developed a situation where LMPs, ancillary service prices, and scarcity demand curve pricing are required to meet the net load ramp. The combination of these procedures are how we arrive at both extreme LMPs and another phenomenon we can view by looking before, during and after the high price spikes. The image below shows 3 market intervals, notice the heavy congestion (yellow circles/lines) before and after the event with the actual price spikes removing most congestion and printing a market wide extreme price signal.

Advanced Warning
Were there early signals to indicate this market event? One signal going into the operating day could be seen with the relatively soft DA prices leading to less gas generation being present for the morning ramp. In the chart below, we see the ISO reported generation numbers for coal (green) and gas (red) throughout the day. With weaker morning DA prices, the gas fleet was not available for much of the morning in both ramp and energy capability. We saw roughly 2.7GW more gas generation for the evening peak versus the morning peak.
-1.png)
.PNG)
Real-Time Generation Signal Flare
On high wind production days, SPP can see incredible penetration statistics. For the 11th, we saw hours with almost 70% of ISO load being covered by wind. Accordingly, wind generation production and ramping are extremely critical RT market signals. With 60-second wind plant production data from Live Power, our view into the wind world is exponentially improved, particularly with the ISO only reporting SPP fleet wind production - a single value representing an area from Texas to Canada. Monitoring select groups of wind farms can provide a leading indicator for SPP fleet production trends since weather patterns start at the ISO boundaries and work across over time. The chart below displays a collection of Live Power monitored wind farms on the edge of the wind production zone in blue, SPP reported wind generation in white and RT Prices in green for reference. In the morning, a signal of falling wind from Live Power plants beat the trend by 25 minutes and in the evening tail-off that signal arrived almost an hour earlier than any ISO generation data series! In addition to providing a leading indicator for changes in wind patterns, the Live Power wind production data is published on a 1-minute basis; whereas, the SPP wind production is reported on a 5-minute basis.
.png)
.PNG)
In summary, granular wind generation data from Live Power provided an early indicator of price spikes to come in SPP due to high wind forecast errors in the morning and evening peak hours on 11/11/21. Generation data from Live Power combined with SPP market data in the Yes Energy platform provides insights before the explosive volatility events happen. For more information about the data used in this analysis, reach out to sales@yesenergy.com or sign up for a demo below.

