Share this
by Gaby Flores
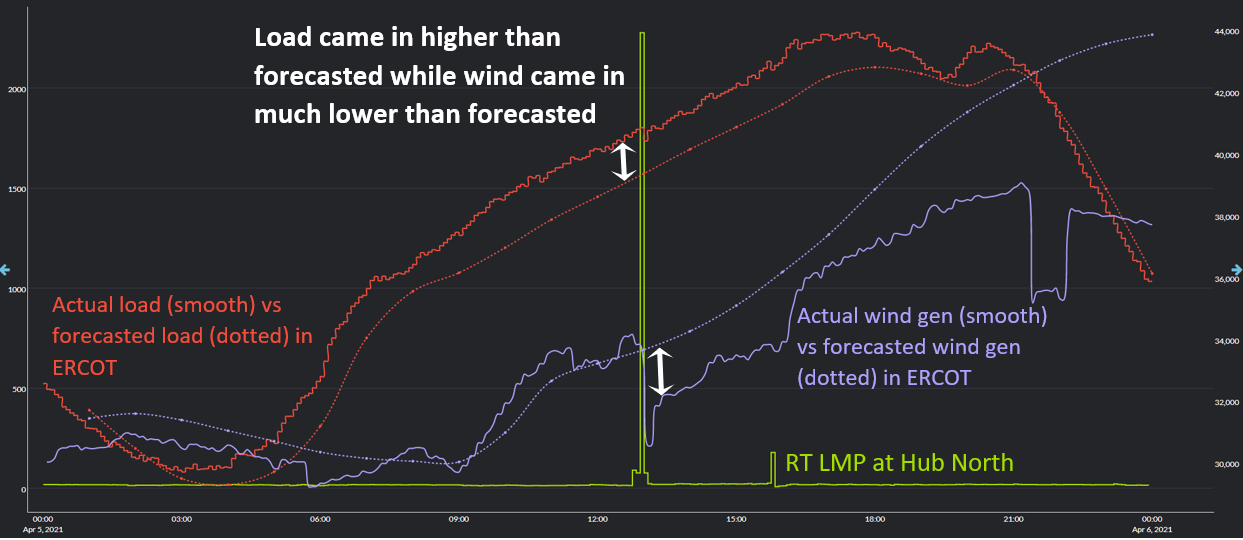
In this market driver alert, we will dive into 4/5/21, which was an eventful day in ERCOT. We will break down what could have led to Hub North spiking to $2,276 and why wind generation may have had something to do with it. In this blog post, we will leverage market data in Yes Energy, alongside 60-second generation data from Live Power and generation outage data from IIR Energy.

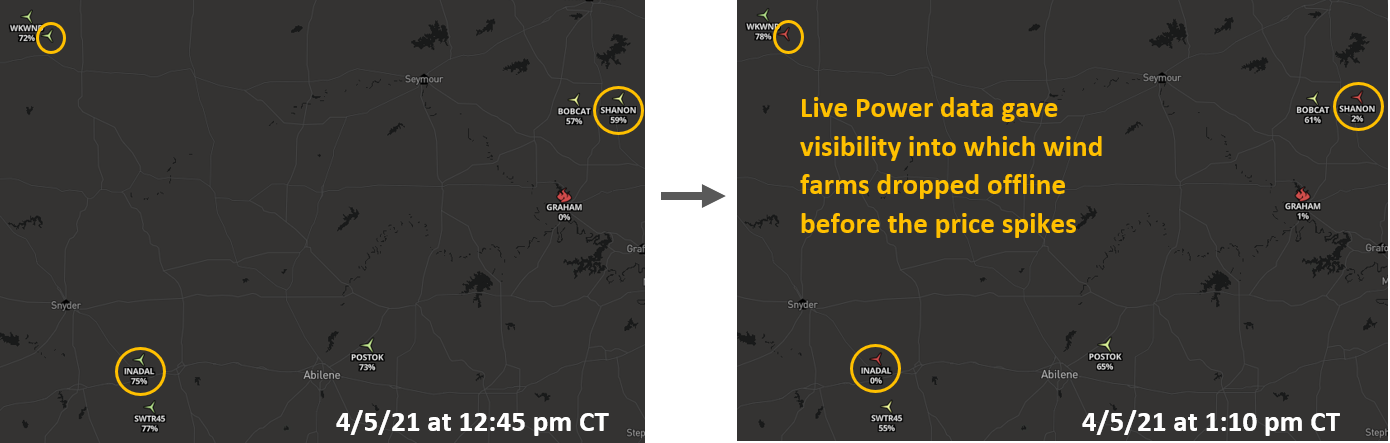
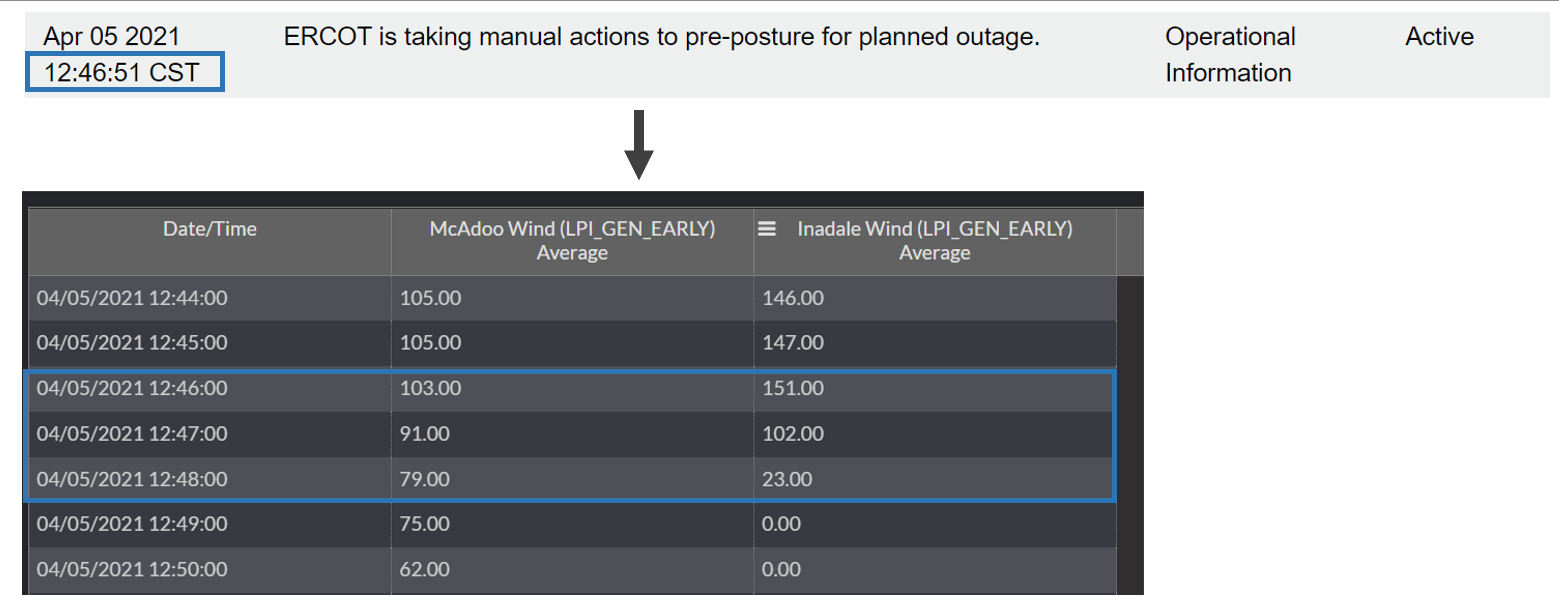
Drilling in another level, Live Power customers had visibility into which wind farms contributed to the missed wind forecast. The screenshot on the bottom left is as of 12:45 pm on 4/5/21 when Shannon Wind, Inadale Wind, and McAdoo Wind were generating at 50-80% capacity. Fast forward 25 minutes and the screenshot on the bottom right shows that these wind farms suddenly went offline. What happened?

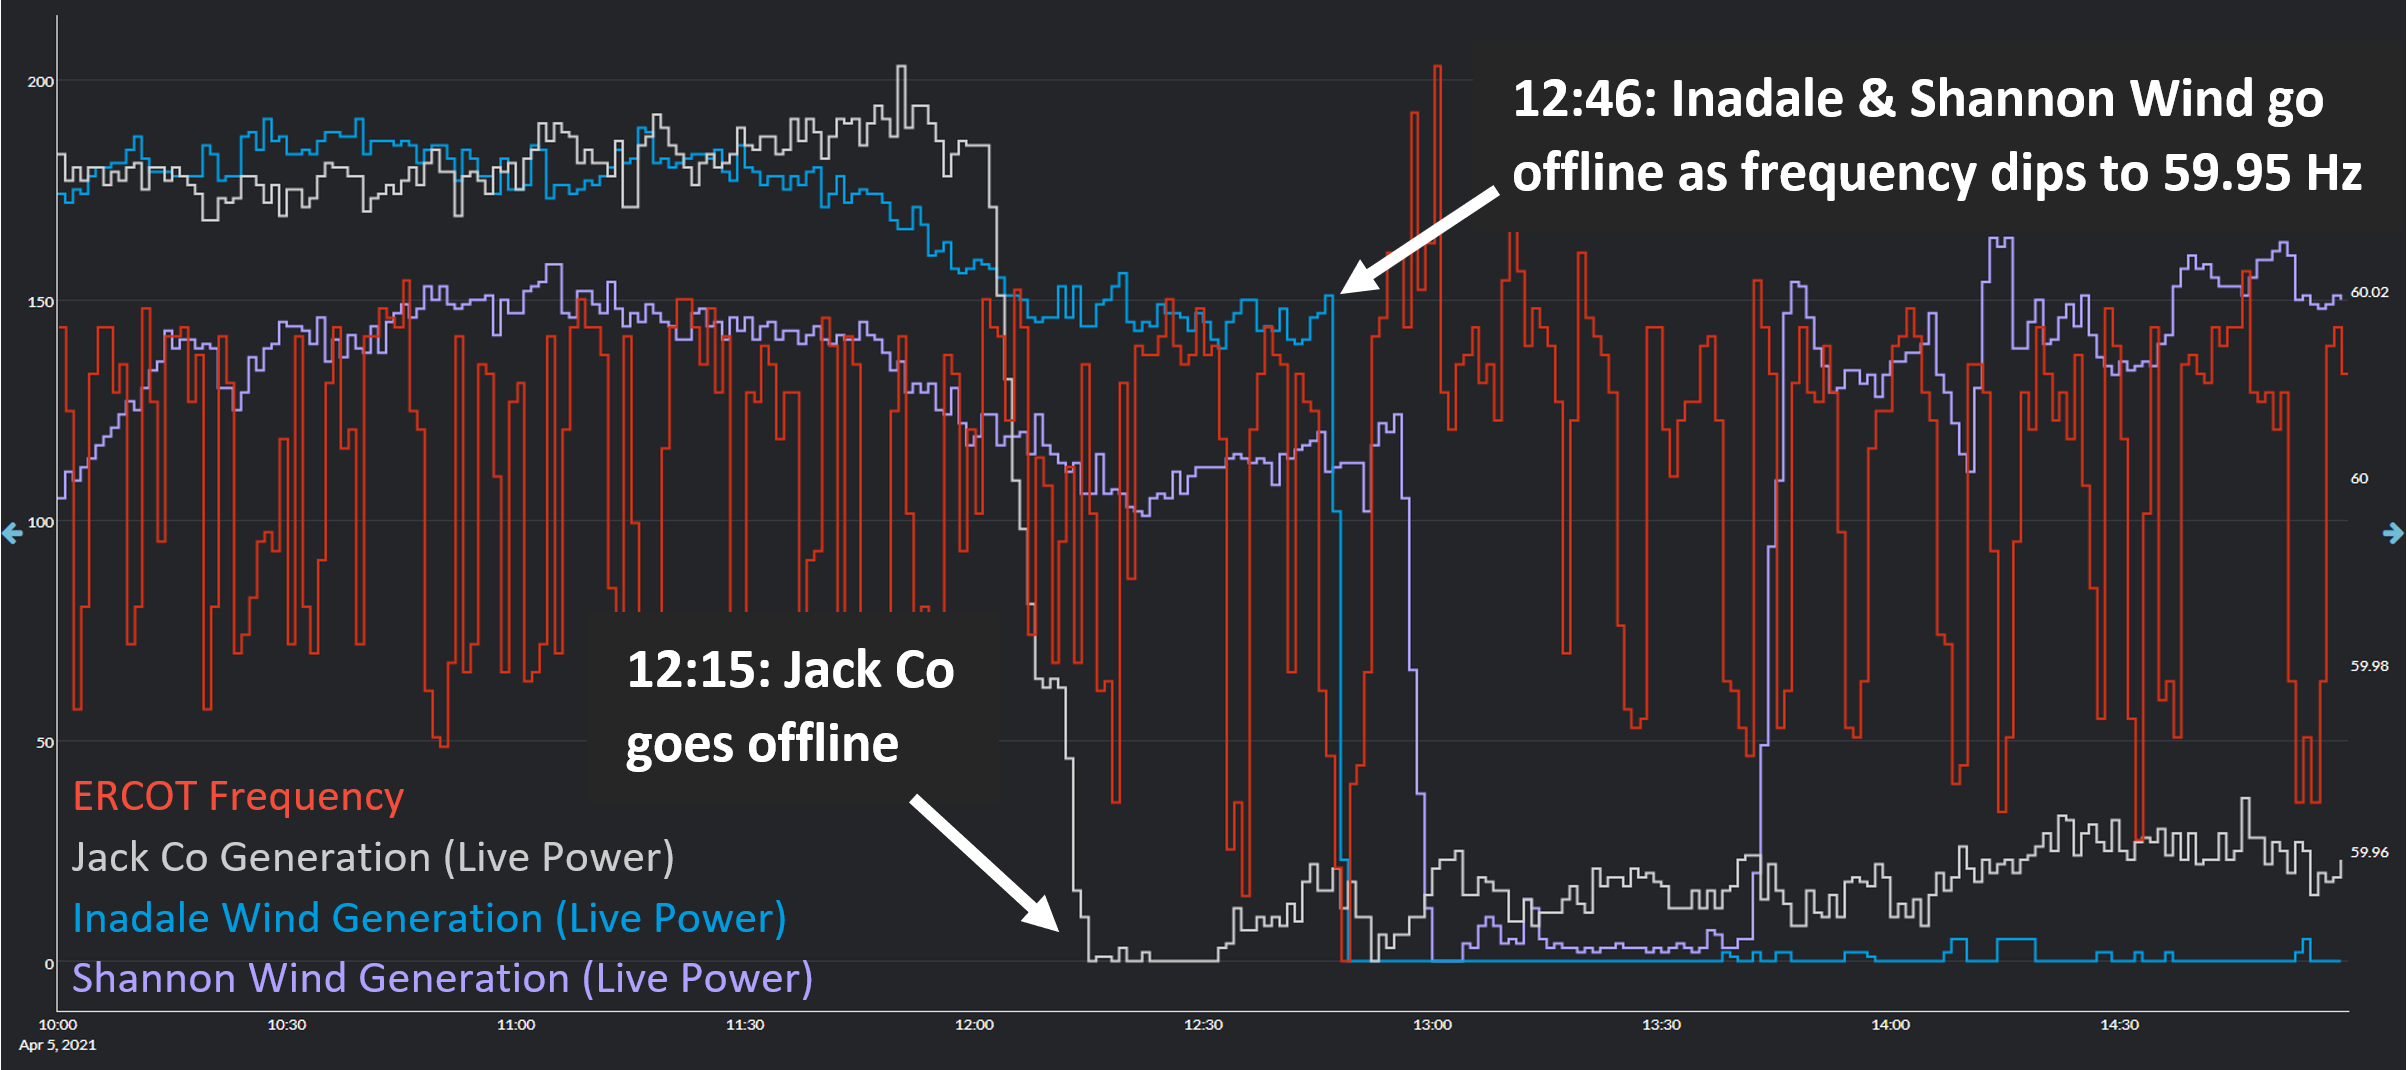
At around 12:15 pm Live Power data showed that Jack County went offline, which was due to a planned outage at the facility (confirmed by our partner IIR Energy). As you can see below, the frequency of the ERCOT grid (optimal = 60 Hz) started to degrade after Jack County went offline. We can see that trend continue until 12:46 pm when Inadale Wind & Shannon Wind started to go offline as the ERCOT frequency dipped to 59.95 Hz at 12:48 pm.

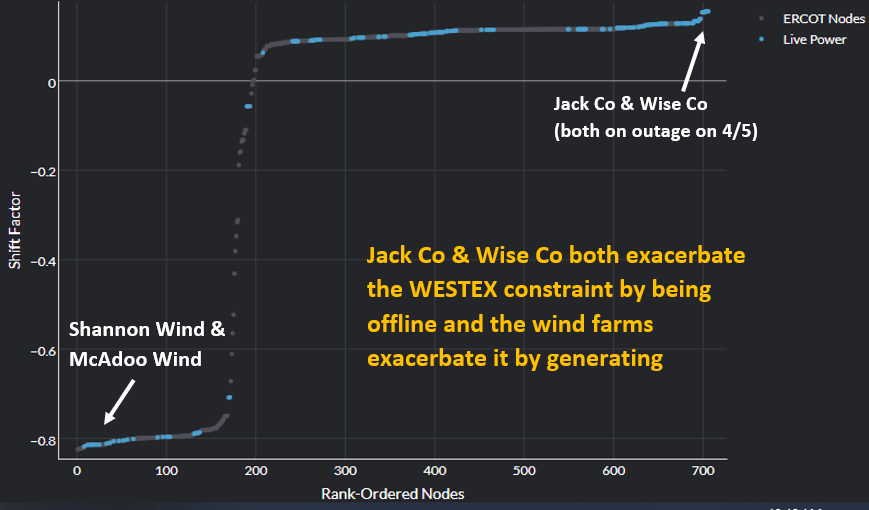
Another element to this event was congestion. At the same time as Hub North spiked at 12:55 pm, the WESTEX constraint bound. WESTEX is a generic transmission constraint and is made up of over 16 transmission lines, many of which Live Power monitors. Jack County and Wise County both have a high positive shift factor relative to the constraint, meaning by generating they help alleviate the constraint, and both had planned outages on 4/5/21 (source: IIR Energy). In contrast, wind farms like Shannon Wind & Inadale Wind have high negative shift factors relative to the constraint, meaning by generating they exacerbate the constraint. There were also ongoing transmission outages in the area around the Riley substation (just north of Shannon Wind), which likely further exacerbated the congestion.

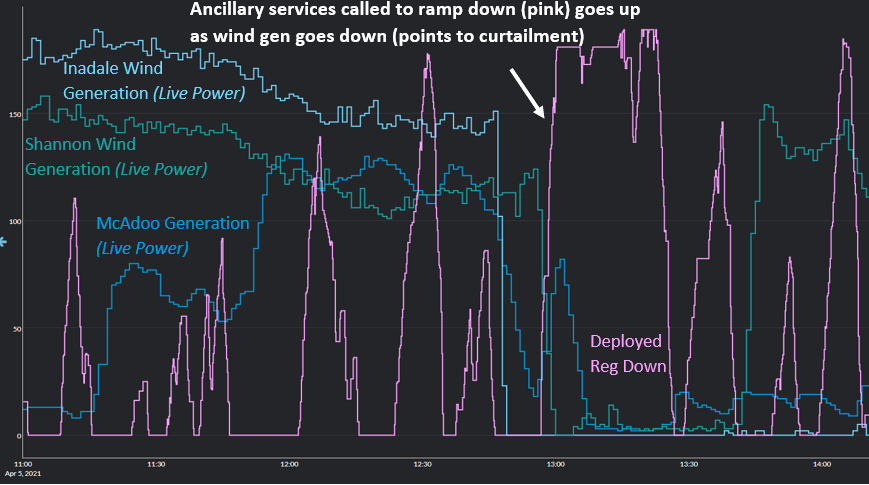
To see whether some or all of these wind farms were curtailed, possibly in an effort to lessen the impact of the WESTEX constraint, we can overlay ancillary services data in Yes Energy against the wind data from Live Power. As you can see below, the amount of ancillary services that were called on to ramp down (pink) increased at the same time as the wind generation data from Live Power showed Inadale Wind, Shannon Wind, and McAdoo ramping down. That in combination with the negative prices at these wind farms around the same time points to these wind farms being curtailed.

Another piece of the puzzle is that at 12:46 pm on 4/5/21 ERCOT released an Operations Message (screenshot below), which said that “ERCOT is taking manual actions to pre-posture for planned outage.” This aligns perfectly with when generation data from Live Power showed that Inadale Wind and Shannon Wind started to ramp down. Since the Jack Co outage happened before this Operations Message was released, it’s possible that these wind farms ramped down for a different planned outage at a power plant or a transmission line in ERCOT.

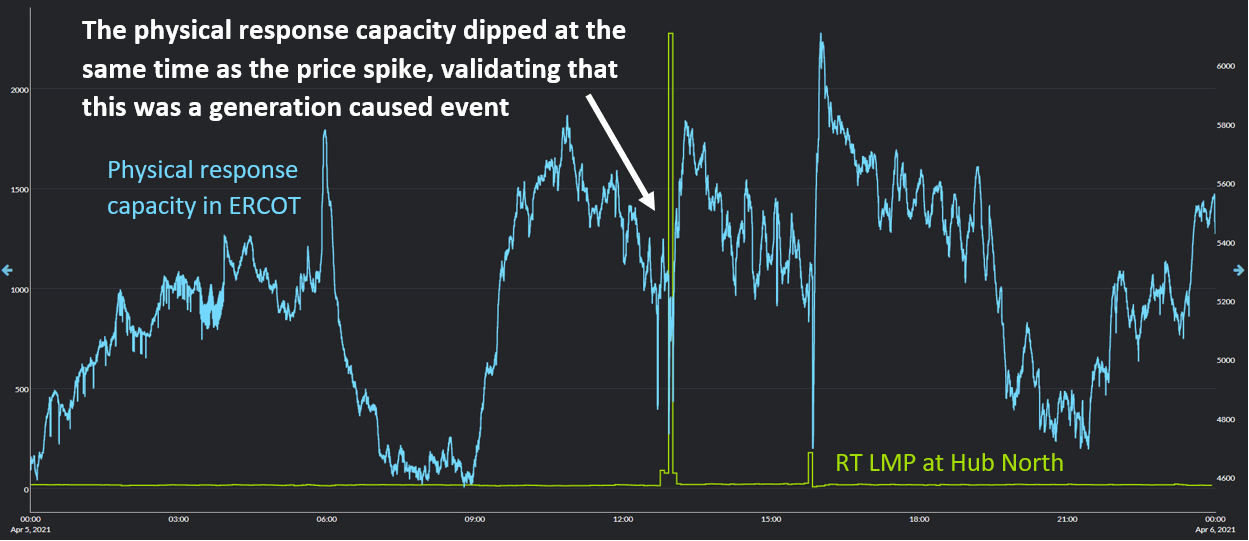
One final piece of market data to look at to confirm what led to the price spike at Hub North is the physical response capacity, which is published by ERCOT and made available in Yes Energy’s products. The physical response capacity represents the total amount of system wide online capability that has a high probability of being able to quickly respond to system disturbances. As seen below, the physical response capacity also dipped to 4,747 MW at 12:55 pm, which was at the same time as Hub North spiked. This is further evidence that this price spike was a generation caused event. This is further validated by comparing the System Lambda, the energy component of the LMP, against the real-time LMP at Hub North (sum of energy + congestion prices), and both were about equal. This tells us that the WESTEX constraint did not contribute (though it was related) to the price spike at Hub North, instead it was the loss in energy at a time when load came in higher than forecasted.

In summary, the volatility that we saw on 4/5/21 seemed to be due to planned generation and transmission outages, which could have led to congestion on the grid that required wind farms to be curtailed at a time when load came in higher than forecasted, thus leading to a generation deficit. All of these factors combined led to Hub North spiking to $2,276 at 12:55 pm.
Traders with access to market data in Yes Energy, alongside 60-second generation data from Live Power and generation outage data from IIR Energy, were able to quickly analyze and react to this event. In the case of Live Power, their data gave traders a signal of a loss in wind generation 3 minutes prior to the ISO reported data. When time is of the essence, pulling together key market data quickly is critical and even a few minutes makes a huge difference.
Sign up for a Live Power demo!