Share this
by Gaby Flores
A Changing Grid
Historically, power markets have been unique for one key reason: electricity has been unstorable, at least on a large scale. However, that is all changing. Utility-scale batteries have improved by leaps and bounds, technology costs are dropping, and there is incentive to deploy batteries to solve the intermittency issues associated with the ever-increasing number of renewable energy resources on the grid. EIA-860 data, which is available in Yes Energy’s DataSignals Cloud product, indicates that over one gigawatt (GW) of battery storage was installed in the U.S. in 2020, over twice what was installed in 2019.This trend is set to continue with recent EIA-860 data showing 172 energy storage projects representing 10.9 GWs of capacity slated for development across 25 states. In this blog post, we’ll discuss how one can evaluate and understand energy storage opportunities on the grid with the help of Yes Energy.
Because batteries do not produce electricity, ideally, batteries will be charged during times when electricity prices are low, and discharged at times when electricity prices are high to maximize profits. For this reason, when siting batteries, it can be helpful to identify volatile locations on the grid that have the best real-time price arbitrage opportunities. This is where Yes Energy comes in.
Market Scanning to Identify Volatile Nodes
Using DataSignals Cloud (DS Cloud), our data product hosted on Snowflake, you can identify and calculate the nodes with the best real-time price arbitrage opportunities. DS Cloud provides the ultimate customization and flexibility for data analysis. In this scenario, we found the daily standard deviation of the real-time LMP during 2020.
To perform this calculation, we limited our results to generator and load nodes and nodes with a history of at least 300 days. Note that you can easily conduct market scans using other volatility metrics, such as realized variance or peak-to-trough calculations.
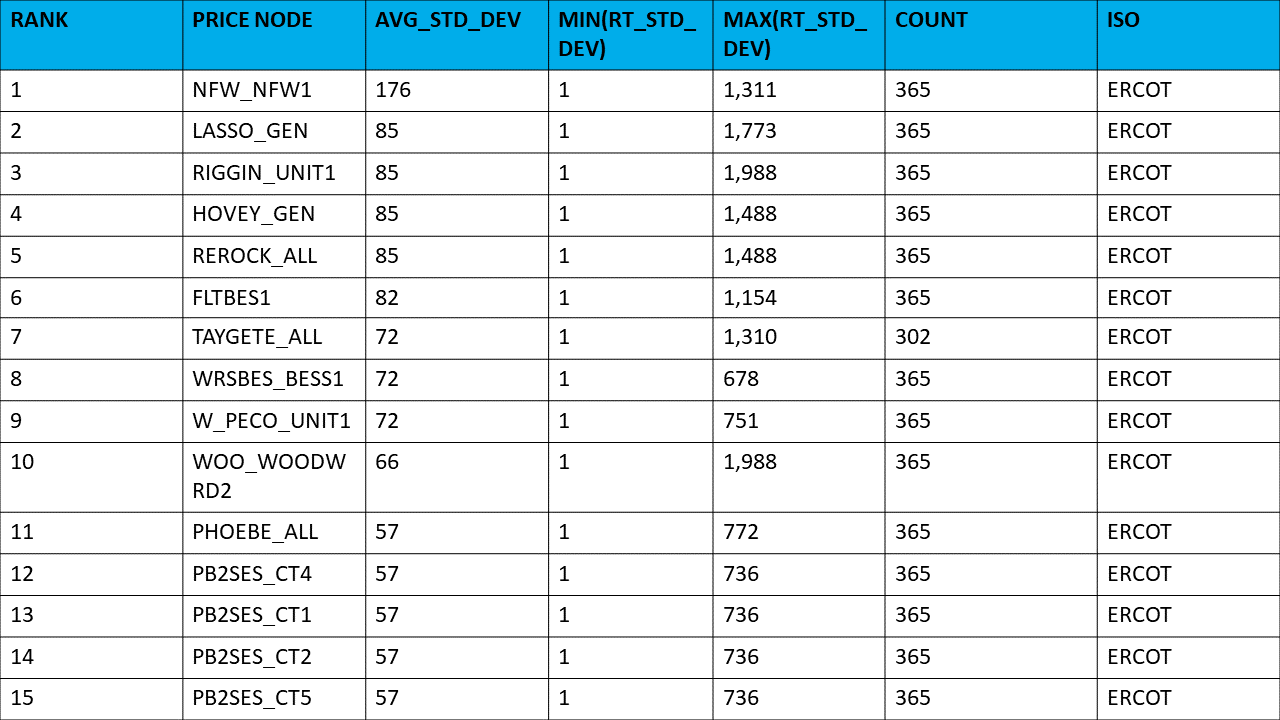

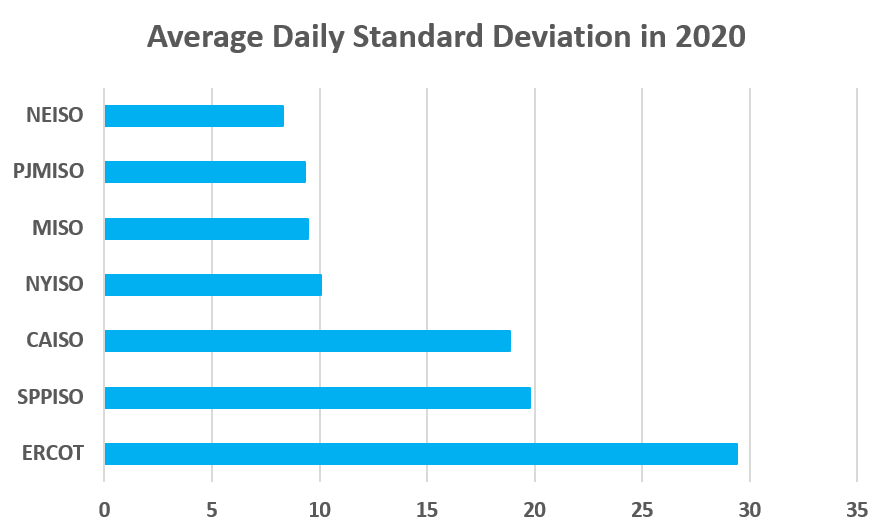
In performing this data analysis, we found that the nodes with the highest volatility are located in ERCOT, SPP, and CAISO. In addition, the volatility in these ISOs is often concentrated around renewable energy assets located in areas where there typically isn’t much load.

Identify When Volatility Occurs
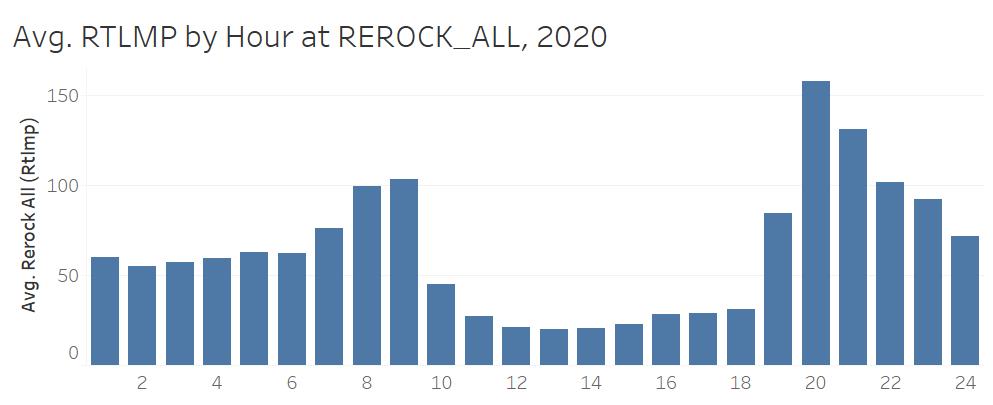
After we’ve identified a volatile node to focus on, we’ll then want to understand when volatility occurs and if that volatility is consistent. For this example, we will focus on the REROCK_ALL node in West Texas. Please note that this example is purely illustrative and doesn't take into account planned transmission and generation infrastructure upgrades that may reduce future volatility in the region.
By extracting REROCK_ALL Real-Time LMP data, we can determine that prices are higher during the morning and evening ramps and lower during the middle of the day (see below), giving us a good indicator of when we should charge and discharge.

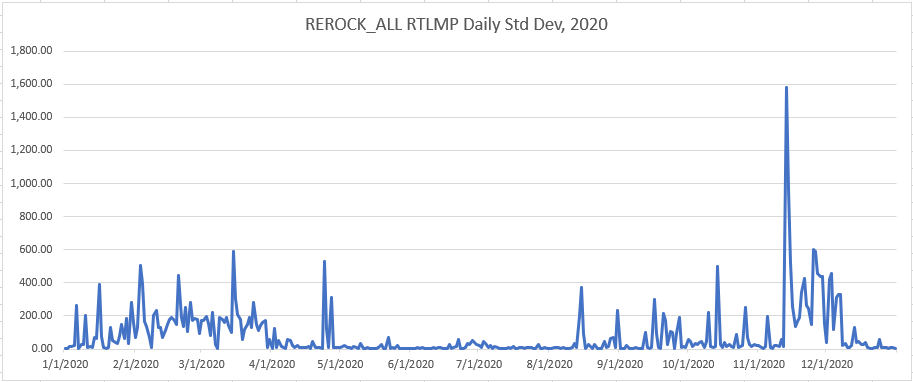
We will also want to examine when volatility occurs and to make sure it is consistent throughout the year and not the result of an isolated event. The graph below shows the daily standard deviation of RTLMPs at the REROCK node in 2020. We can see that price volatility is consistent throughout 2020, decreasing in the summer.

Identifying Causes of Volatility
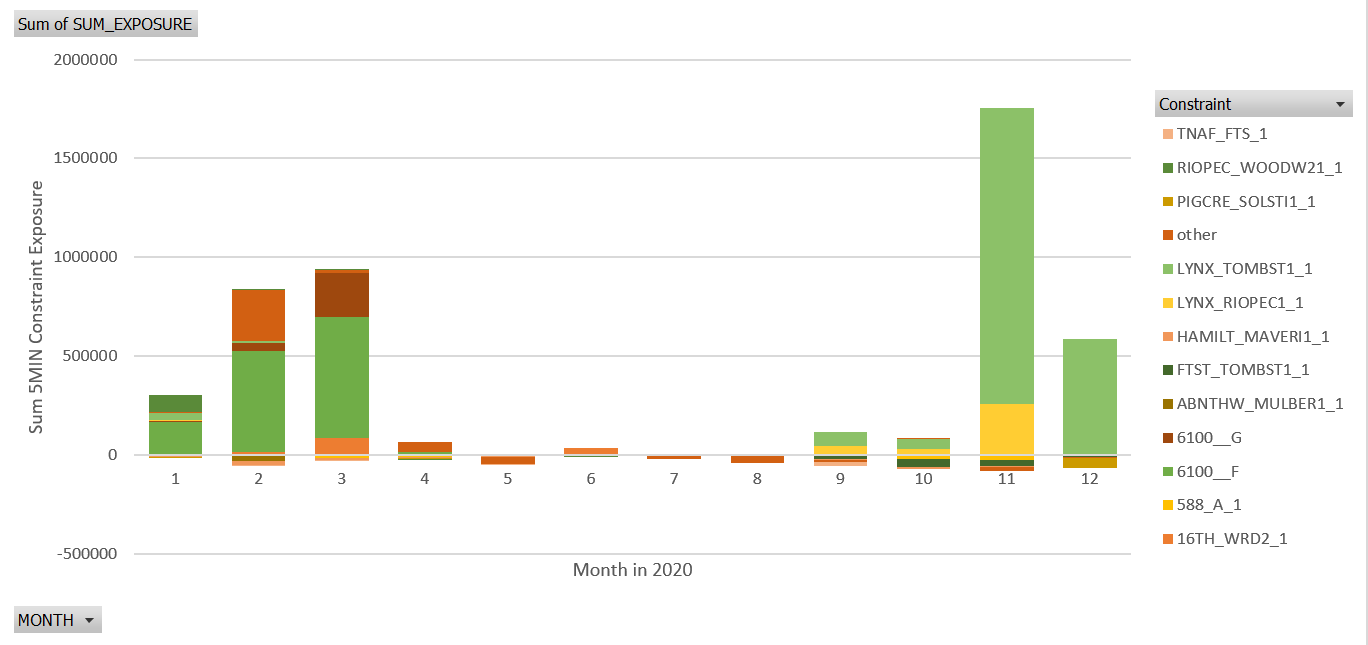
Using Yes Energy’s tools, we can dig in further to understand the causes of volatility. In the case of REROCK_ALL, congestion was a major driver of volatility. Using DS Cloud, we can actually plot the impact of each constraint affecting REROCK_ALL. Here we can see that different constraints caused volatility in certain months with 6100__F driving prices in the first part of the year and LYNX_TOMBST1 driving prices in the second half of the year. This is another positive sign for siting storage as we have determined that volatility here is not caused by a single constraint on the ERCOT system.
We can even do further analysis to determine the causes of these constraints to get a complete picture of volatility drivers at REROCK_ALL.