


Share this
Wind generation across all ISOs is on the rise, and all indications suggest this trend isn’t going away. This growth will continue to impact power market operations and trading strategies. Wind and solar are less predictable and more intermittent, meaning power market participants will need to adjust their strategies to hedge and capture opportunities around this potential volatility.
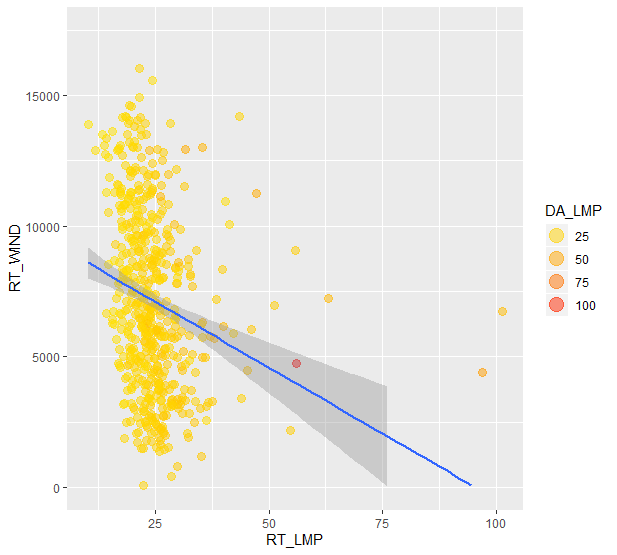
As shown in the example below, typically there is an inverse relationship between wind generation and real-time LMP (RT-LMP). We also see a good deal of volatility. The ERCOT market has seen this volatility in west Texas, often related to lower wind generation, resulting in LMP price spikes. ERCOT (and other ISOs) have also seen negative pricing as a result of high wind generation.
Here’s a look at the Nodal Profile for a price node associated with the McAdoo Wind Farm in west Texas. Using Live Power real-time monitored wind generation data we can easily see the correlation between the wind generation and the real-time price.
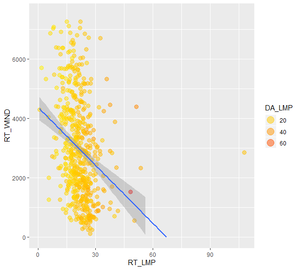
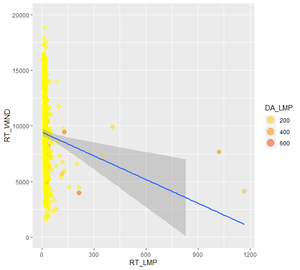
This is an example of just one wind farm, but running an analysis across all ISOs we saw this inverse relationship remain true (with the exception of NEISO). Across SPP, MISO, ERCOT, and PJMISO when wind generation is high real-time and day ahead LMP is lower:

.png)
-1-1.png)


-2-1.png)


Knowing how much wind generation can impact the real-time LMP this is a variable that power market participants need to have as much data as possible to ensure they are making informed decisions. In addition to all of the other market data you can access through Yes Energy to help inform these decisions, we also partner with other data and analysis providers that give you wind forecasts (e.g., 3Tier Vaisala). Our partner Live Power provides real-time wind generation. These are crucial tools to have in your belt when trading around wind, but many of our customers also prefer to add in their own modeling and analyses. These internal tools, used alongside the rest of the data in Yes Energy, make your insights more accurate.
To help you build your own internal analyses, Sam Lockshin, Yes Energy’s data scientist and product manager, created a time series analysis that uses deep learning models (recurrent neural networks) to model hourly real-time wind generation for West ERCOT. The model and analysis are meant to offer a starting point for building your own time series analysis. Plotted below are model values alongside actual hourly real-time and ERCOT’s hourly short-term forecast wind generation series.
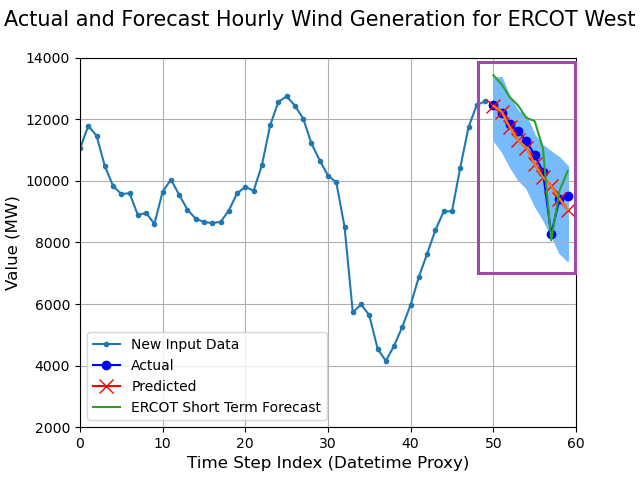
The model can be better seen by zooming into the purple box above:
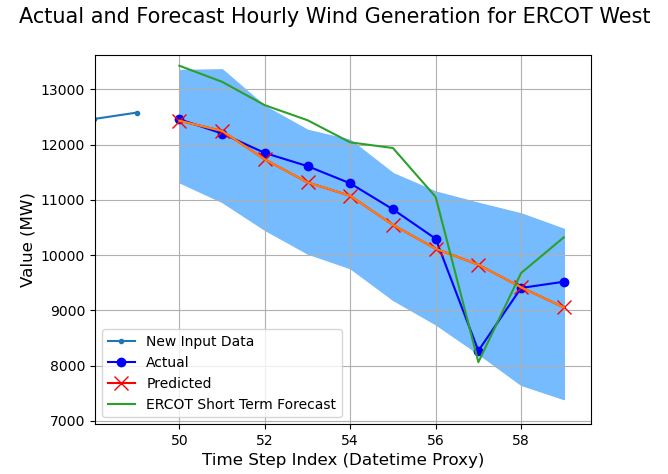
The blue region delineates the range of forward-looking values at each step by the model, effectively capturing model uncertainty/ the confidence range for each time step. This highlights one of the benefits of a user-defined model: instead of outputting a single value, the model can produce a range of values. Furthermore, the number of model points can be controlled.
For Yes Energy customers, the code, graphs, and further discussion can be accessed on our code repository on GitLab.
Not a Yes Energy customer but want to learn more?

 About the author: Sam Lockshin is the product manager of the data products at Yes Energy. He has a passion for programmatically delivering Yes Energy’s high-quality power market data catalog to customers so they can achieve their business goals. You can catch him at karaoke, playing piano, or checking out the latest horror flick. You can catch him on LinkedIn.
