


Share this
by Gaby Flores on Oct 11, 2021
Continued development of wind generation throughout MISO presents interesting challenges when reviewing market dynamics. Knowing how specific resources are reacting to different market signals at an operational level is made possible with real-time generation data from Live Power. Having all of this data in one place will continue to be important as MISO market congestion remains active and persistent around areas of heavy wind development.
In this blog post, we examine the MISO constraint Split Rock to White 345 KV line with a contingency of the Hawks Nest Lake to Lyon Co 345 KV transmission line. This particular constraint has bound over 300 hours so far this year (most recently bound on 9/29/21) and has led to significant price impacts in the surrounding area.
Figure 2 below is a geographical representation of the constraint on the system. The associated price impacts (shift factor data) are displayed for different nodal prices in the local area around the system constraint. The blue nodes below represent a decrease in prices, which means the generators received a signal to reduce their generation to alleviate the congestion. Wind farms to the north of the constraint like Buffalo Ridge and Blazing Star Wind received these negative price signals to curtail their generation. Conversely, the red nodes to the south of the constraint represent an increase in prices, which means those generators received a signal to increase their generation to alleviate the congestion.
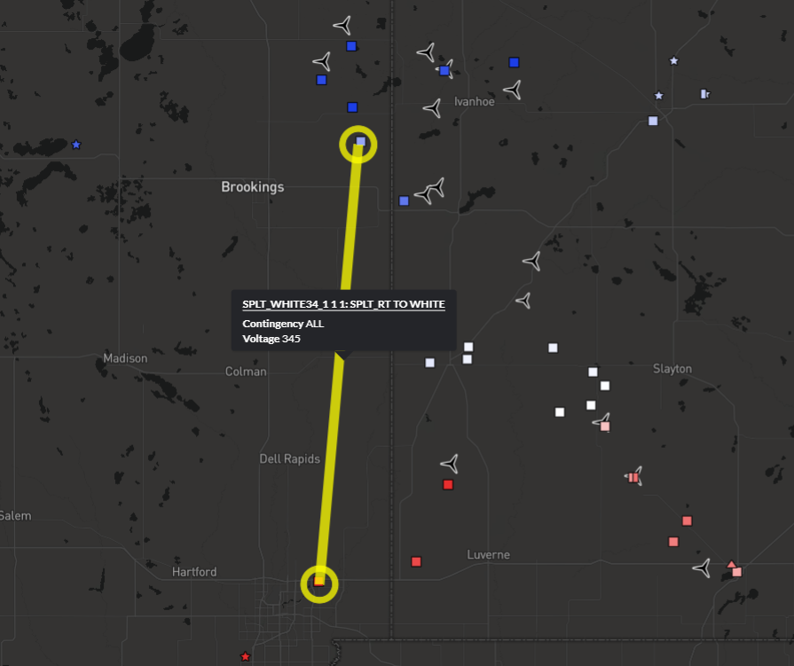

Figure 2. Split Rock to White 345 KV line with a contingency of Hawks Nest Lake to Lyon Co. (also a 345 KV line). Visualized in Yes Energy’s PowerSignals product.
In a traditional view, as prices decrease at a generator, the expectation would be a lowering of generation output according to the asset’s offer curve. In the congestion analysis below, we are actually viewing prices around negative $20 for most of the points north of the constraint. In Figure 3 below, we see a chart of Live Power monitored facilities and their impacts on this constraint. The Blazing Star 1/2 and Red Pine Wind facilities monitored by Live Power (referred to as “Blazing Star wind facilities” in the remainder of this blog post) have the largest ability to alleviate this constraint by decreasing output and therefore also receive the largest share of downward price destruction.
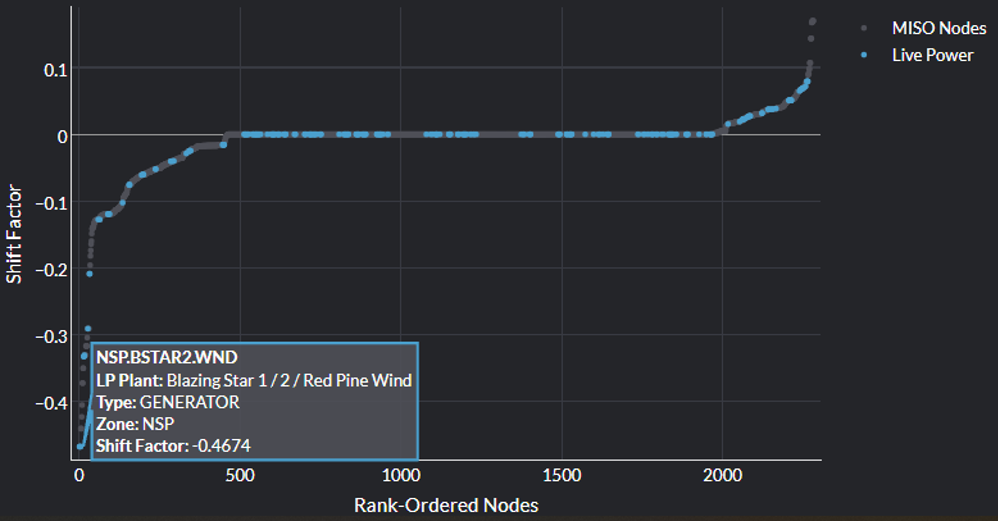

Figure 3. Shift factor data for the Blazing Star wind facilities relative to the Split Rock to White 345 KV constraint.
Figure 4 represents the correlation between increased generation at the Blazing Star wind facility and it’s exacerbation of the congestion on this constraint. This shows that the constraint binds more often the higher the output at the Blazing Star wind facilities (source Live Power).
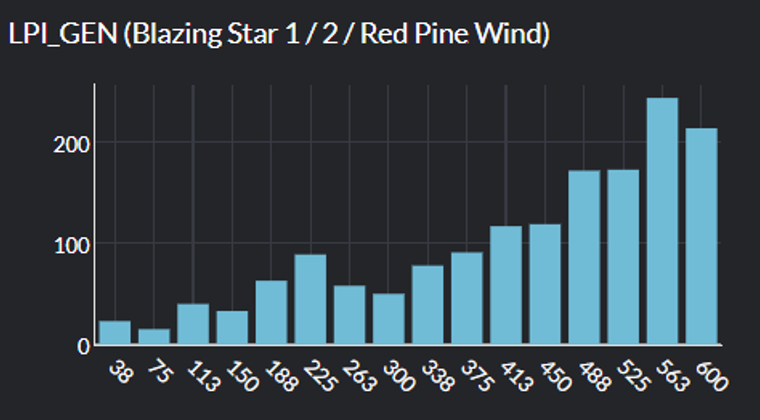

Figure 4. Histogram showing Blazing Star wind facilities’ generation (x-axis) relative to the instances that the Split Rock to White 345 KV constraint bound. Source: Live Power.
With these pieces of information, we would expect an outcome of decreased generation at points north of the congestion to relieve this market condition. However, what we are able to expose with the market insight from Live Power’s real-time generation data is actually a mix of behaviors.
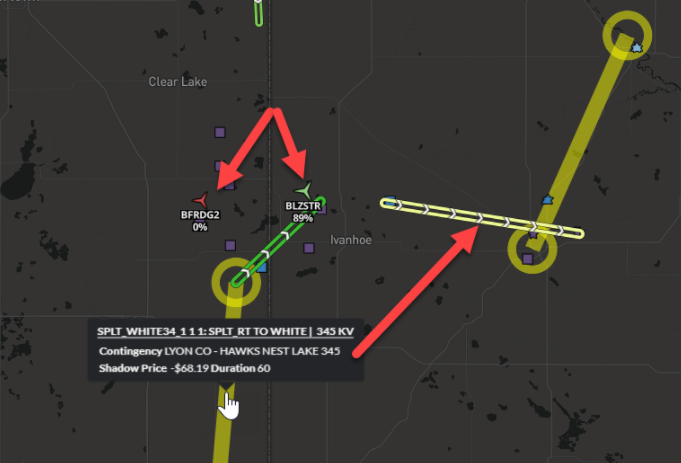

Figure 5. Visual representation of polar opposite generation patterns between Buffalo Ridge II and the Blazing Star wind facilities when the Split Rock to White 345 KV line binds, which is unexpected given they both have a high negative shift factor relative to the constraint (incentivized to reduce generation). Source: Live Power & Yes Energy.
Within this set of market data we see several items of interest. Two wind facilities separated by mere miles and, thus, exposed to the same amount of potential generation from wind are operating as nearly polar opposites. The Buffalo Ridge facility to the west of the Blazing Star wind facilities was curtailed in response to the negative price signals. The Blazing Star wind facilities however are operating at near full capacity. Additionally, the output at the Blazing Star wind facilities are also placing increased line flow pressure on the Hawks Nest Lake to Lyon Co line which is the contingency for this event, again, adding to the congested condition. Without the ability to view facility level data using Live Power data, these different operating behaviors would not be known and at best rough assumptions would be made based on regional wind speeds. With this data we can now see why this congestion persisted as one of the instigating facilities for this congestion (Blazing Star / Red Pine) continues to operate at full output despite the negative price signals it is receiving from MISO.
With this information provided only by Live Power real-time generation data, another question can now be asked. Why is there opposite operating behavior for Buffalo Ridge compared to the Blazing Star wind facilities? One clue can be provided by the associated operational data for each facility. Selecting these facilities on the map, we see Buffalo Ridge became operational in 2010 and Blazing Star became operational in 2017 and 2020. Our attention now can turn to two other questions; does either facility still have Production Tax Credit (PTC) benefits and what type of contracts are in place for this energy? We can make a general assumption that after the first 10 years of operation, the production tax credits expire. In this case that would be likely for the Buffalo Ridge facility but not Blazing Star.
Another tool can be utilized at this point is Yes Energy’s Transaction View product, which includes data from the Federal Energy Regulatory Committee’s (FERC’s) Electric Quarterly Reports (EQR) in both deregulated and regulated markets and transforms it into easily consumable and actionable formats for analyses like these. Below, in Figures 5 and 6, we see a change with the offtake agreement transactions around Buffalo Ridge. Through Q1 of 2020, the contract is bundled energy including the renewable credits. After Q2 we see the contract becomes purely energy, also confirming why the plant would no longer wish to produce power when prices fall below zero dollars.


Figure 6. EQR data for the Buffalo Ridge II facility for Q1 2020. Source: Yes Energy’s Transaction View product.


Figure 7. EQR data for the Buffalo Ridge II facility for Q2 2020. Source: Yes Energy’s Transaction View product.
As the grid and markets continue to see greater renewable penetration, the need for more granular data is exposed. Market-wide generation stats and weather forecasts are no longer enough to paint a complete picture of generator operations throughout the supply stack. In summary, Live Power data, alongside Yes Energy market data (constraints, nodal prices), as well as EQR data in Yes Energy’s Transaction View product, provides much needed transparency into the ever changing market dynamics due to the increased penetration of renewables.

