


Share this
In this blog post we’ll dive into what happens when load comes in higher than forecasted in PJM and why having data from Live Power can make or break a trade.
We will answer:
-
What is the price impact and which generators step up to meet the additional demand?
-
How does having Yes Energy market data alongside generation data from Live Power give Yes Energy customers insight into these types of events so they know what to expect in the future?
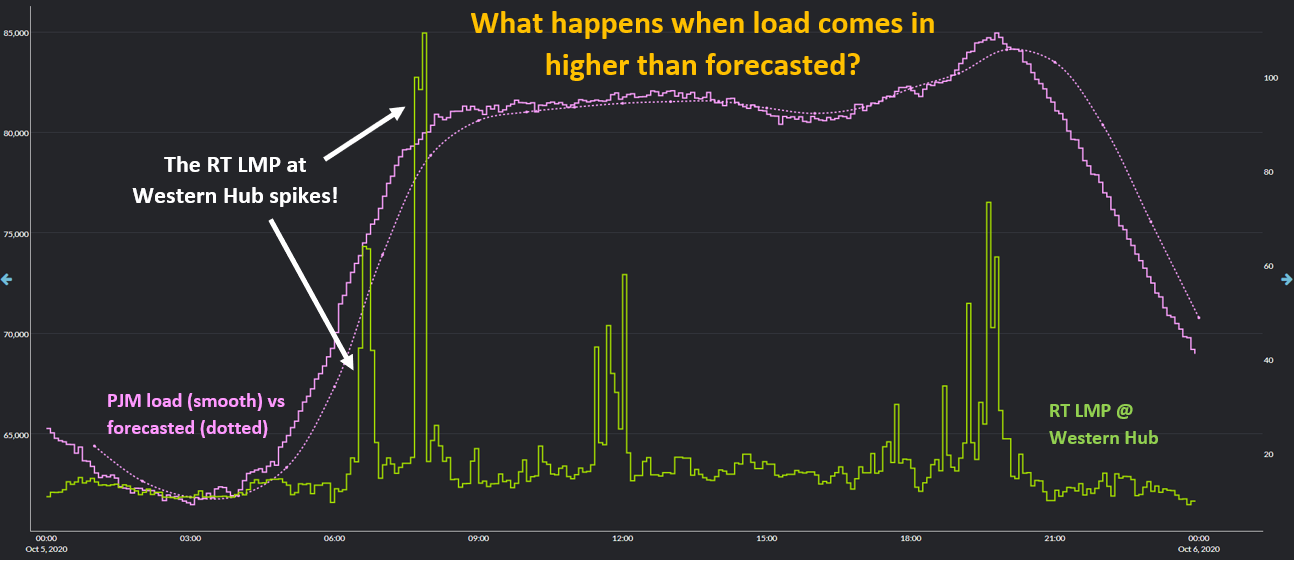
On October 5th this is exactly what happened in PJM. Load came in higher than forecasted in the morning and evening peak hours, which contributed to price volatility at Western Hub, reaching a max real time (RT) LMP of $109 at 7:50 am ET. As you can see below, when the RT load (smooth pink line) is higher than the forecasted load (dotted pink line) the RT LMP at Western Hub (green line) spikes, which is expected.

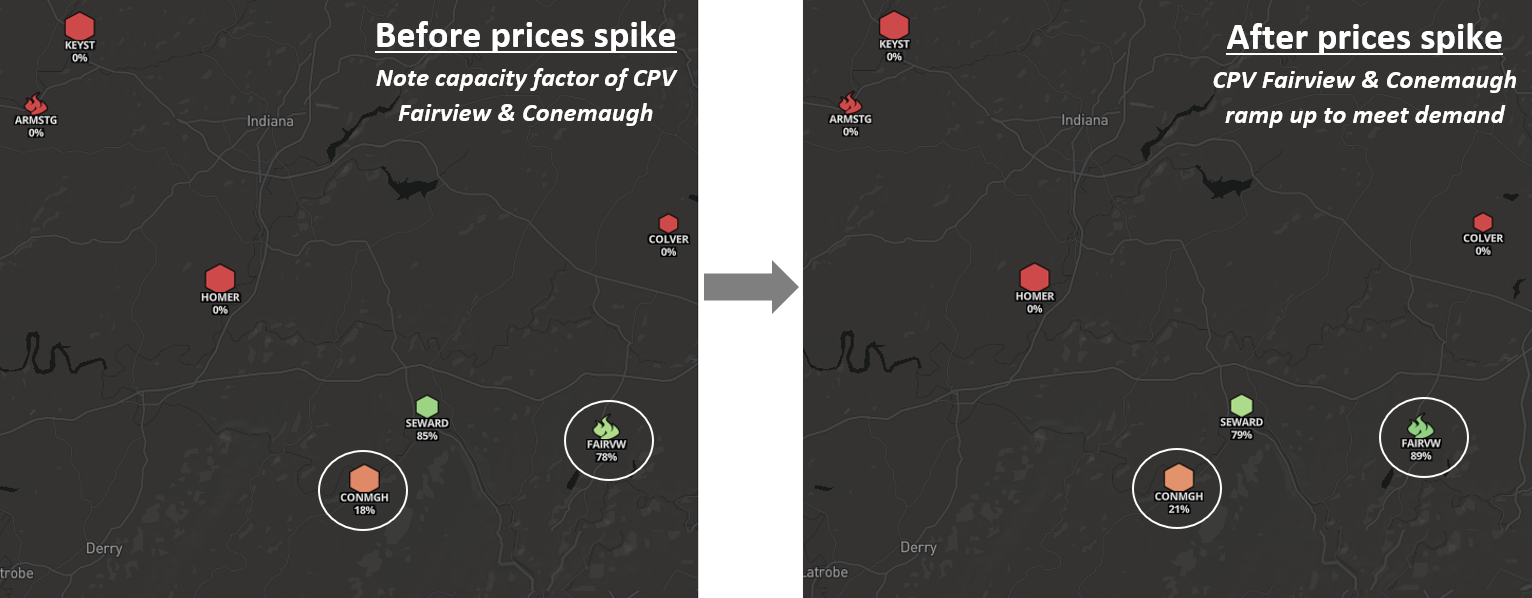
Which generators responded to load coming in higher than forecasted? Using Live Power data in Yes Energy, traders can see that the Live Power monitored generators Conemaugh and CPV Fairview ramped up to meet the additional demand. On the left is a snapshot of the grid before prices spiked and we can see that Conemaugh was operating at an 18% capacity factor (CF) and CPV Fairview was operating at a 78% CF. Once prices spiked around 6 am we can see on the right that Conemaugh ramped up to a 21% CF and CPV Fairview ramped up to a 89% CF.

Given that we are in the middle of outage season, when load comes in higher than forecasted there may be fewer generators available to ramp up quickly. Using data from our partner IIR, you can know which and when generators are scheduled to be offline. This gives you a sense for which generators are able to respond to additional demand. Using 60 second data from Live Power, traders are able to validate in real time which generators respond to price volatility due to increased demand.
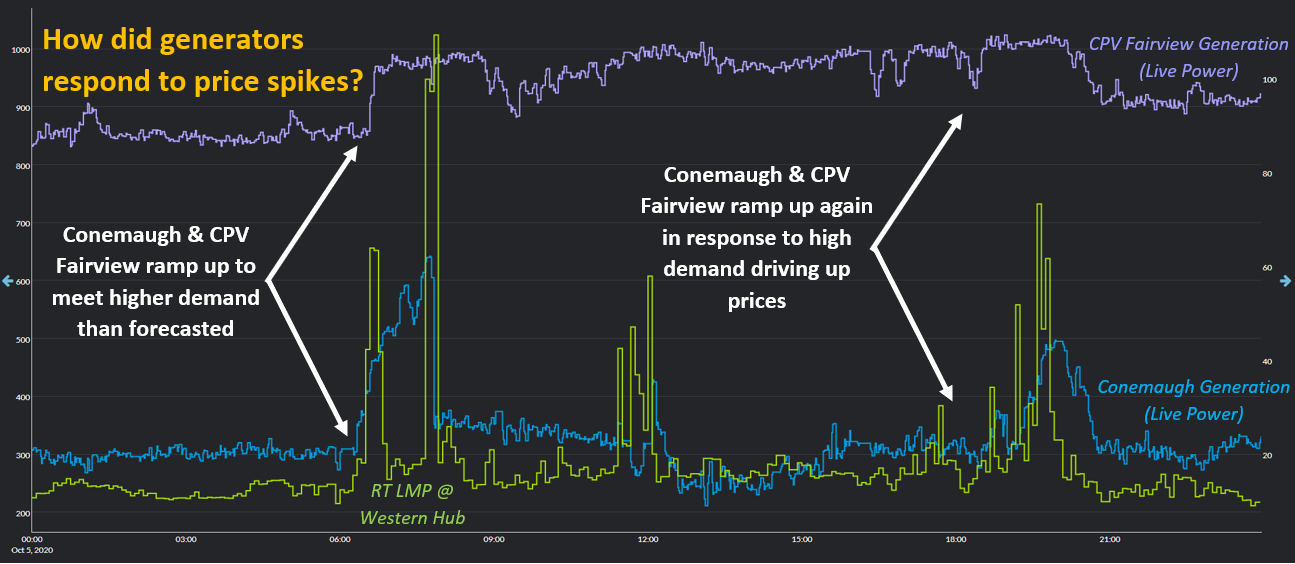
To visually see how Conemaugh and CPV Fairview ramped up to meet the higher demand than forecasted in the morning and evening peak hours, we can look at the chart below. As you can see, Conemaugh (blue) and CPV Fairview (purple) ramped up in response to the price spikes at the start of the day between 6 am and 8 am. This information helped traders later in the day when load came in higher than forecasted once again, which caused the RT LMP at Western Hub to spike to $73. As to be expected, both Conemaugh and CPV Fairview ramped up again in response.

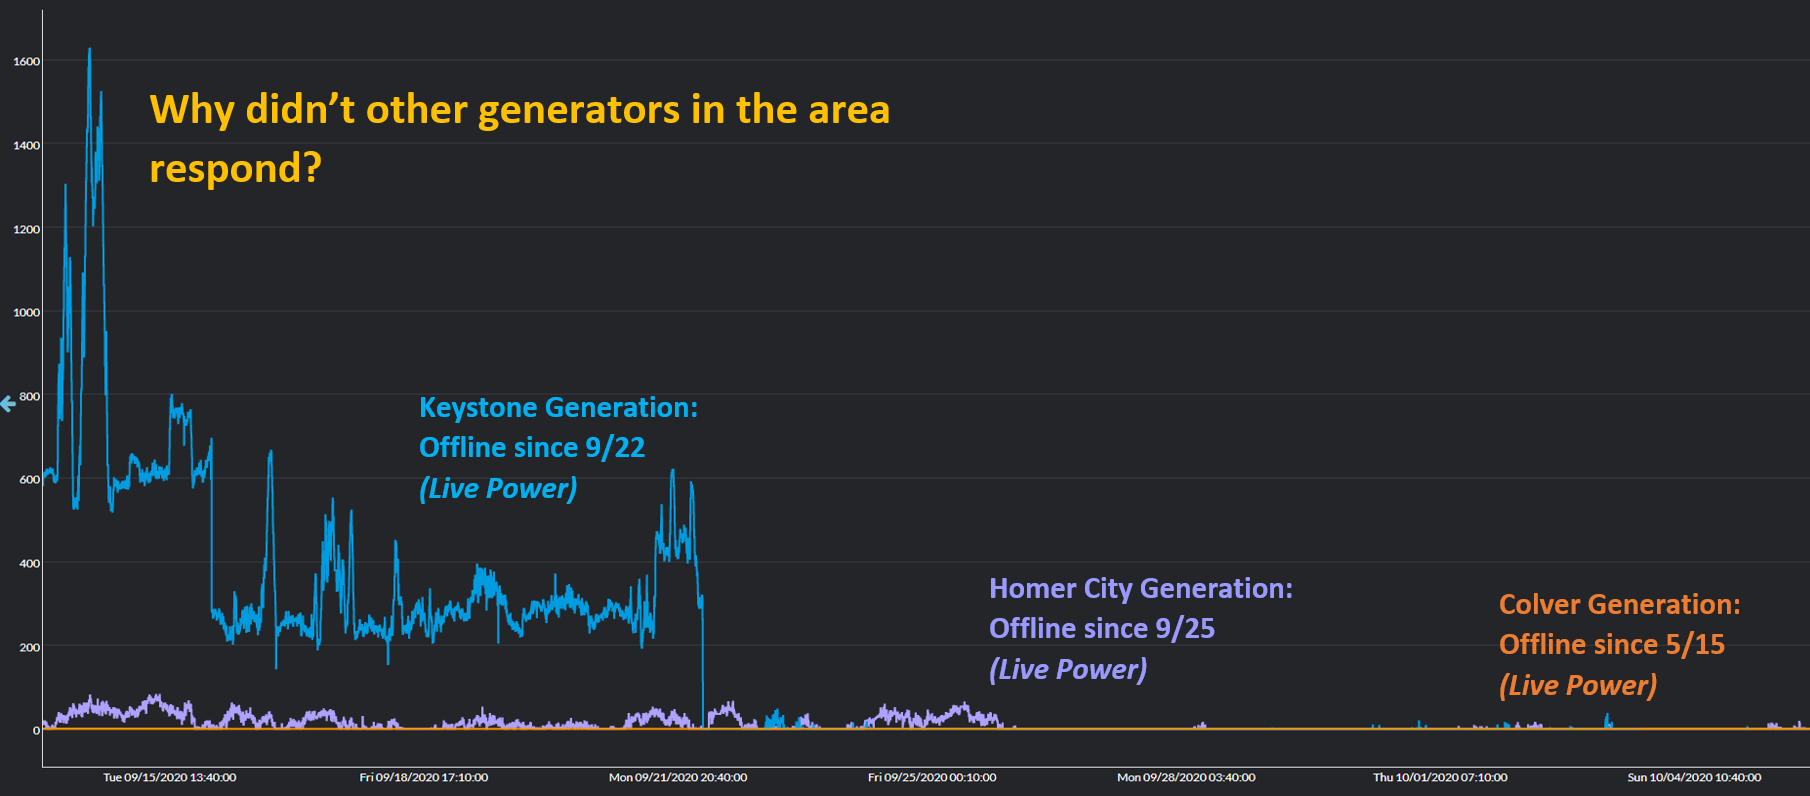
Why didn’t other generators in the area respond? For example, why didn’t Keystone, Homer City, or Colver ramp up in response to the additional load? Using historical data from Live Power, we can see that many of these generators have been offline for a few weeks (Keystone, Homer City), and others have been offline for a few months (Colver). There are a host of reasons why these generators could be offline (e.g., maintenance) and did not respond. Regardless of the reason, the historical data from Live Power gives traders insight into which generators are likely to respond based on recent generation behavior. The real time generation data from Live Power gives traders insight into which generators actually did respond.

Bottom Line: The lack of available capacity in the area likely contributed to the price spikes at Western Hub on 10/5, coupled with load coming in higher than forecasted. Generation data from Live Power shows traders which generators did not respond (Keystone, Homer City, Colver), and which generators stepped up to meet the additional load (Conemaugh, CPV Fairview).
Using market data in Yes Energy, alongside data from our partner Live Power, traders can understand the generator response to load coming in higher than forecasted. In the case of October 5th, seeing the generator response to the forecast error in the morning allowed traders to be prepared for when there was forecast error again later in the day during the evening peak hours.
Don’t go in blind to market volatility. Learn more about the power of data from Yes Energy and Live Power by filling out your contact information below. We will schedule a one-on-one with one of our market experts on how this data could make or break your trade.

