Share this
by Max Lotspeich on Jun 22, 2020
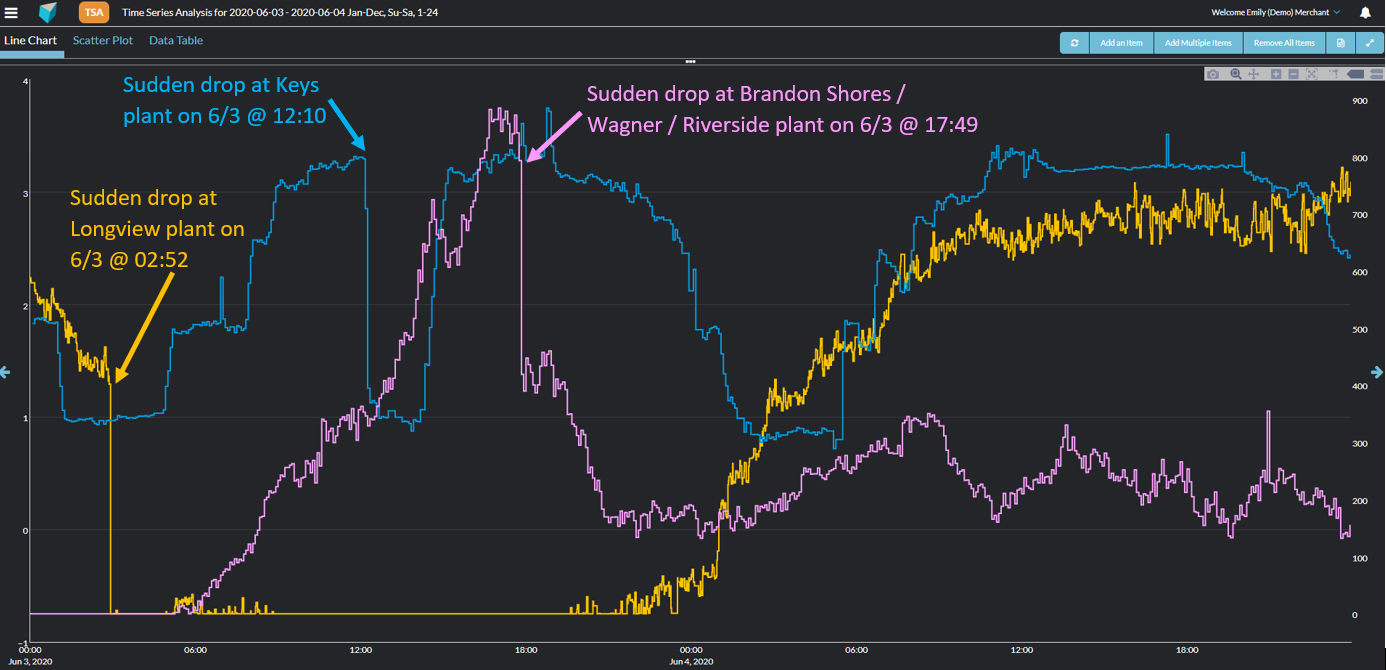
In this Market Driver Alert, we take a closer look at PJM’s Western Hub, where several sudden drops across a number of plants resulted in price spikes during the first week of June. We’ll walk you through how load and constraints influenced prices, and how Live Power provides the generation and transmission data you need to be better prepared for these events in the future.There were a number of sudden drops at Live Power monitored facilities throughout the first week of June, including:
-
Brandon Shores / Wagner / Riverside on 6/3 at 17:49
-
Longview on 6/3 at 02:52
-
Keys on 6/3 at 12:10.

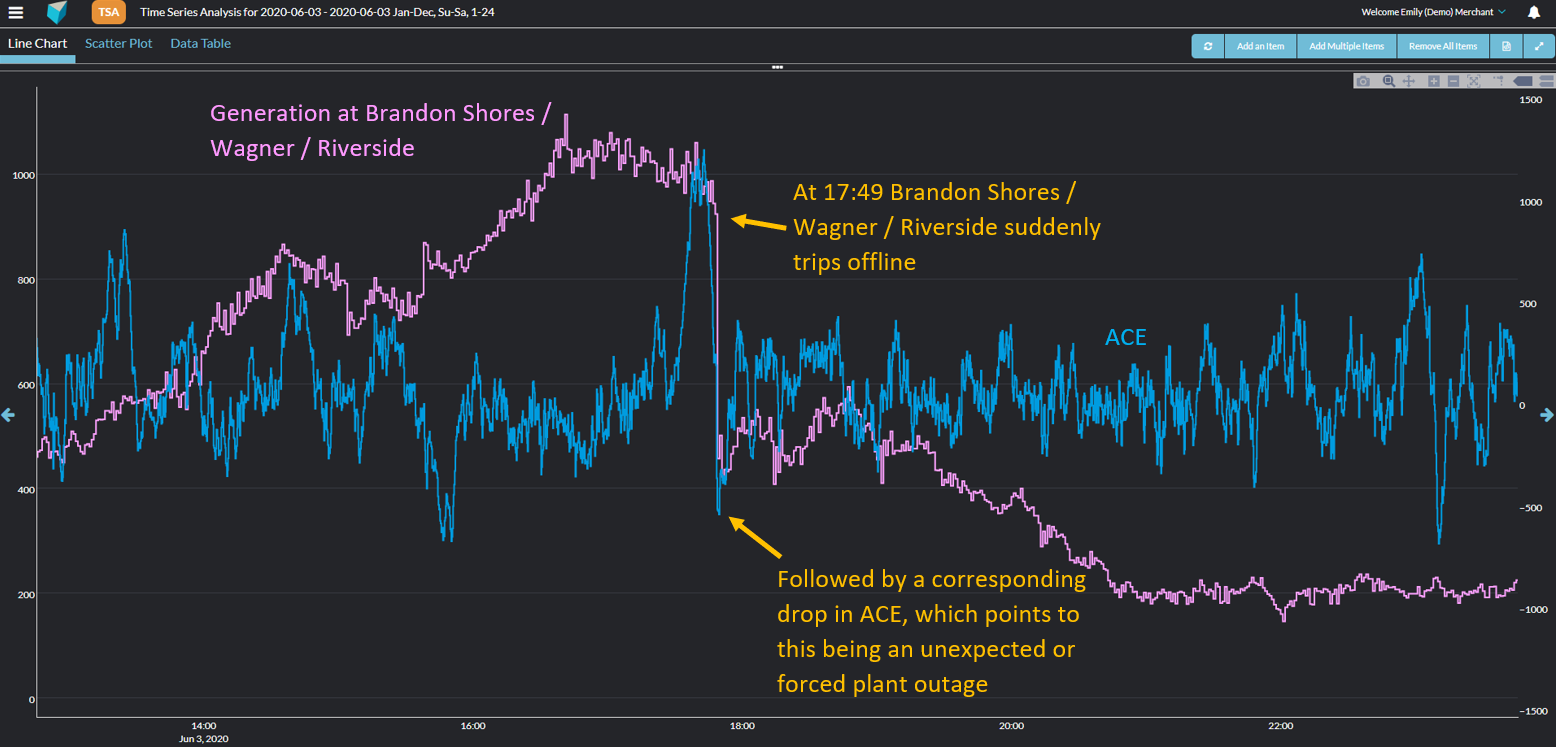
Let’s hone in on the sudden drop at Brandon Shores / Wagner / Riverside. As seen below, when it suddenly tripped offline at 17:49 on 6/3 there was a corresponding dip in ACE, pointing to this being an unexpected or forced outage.

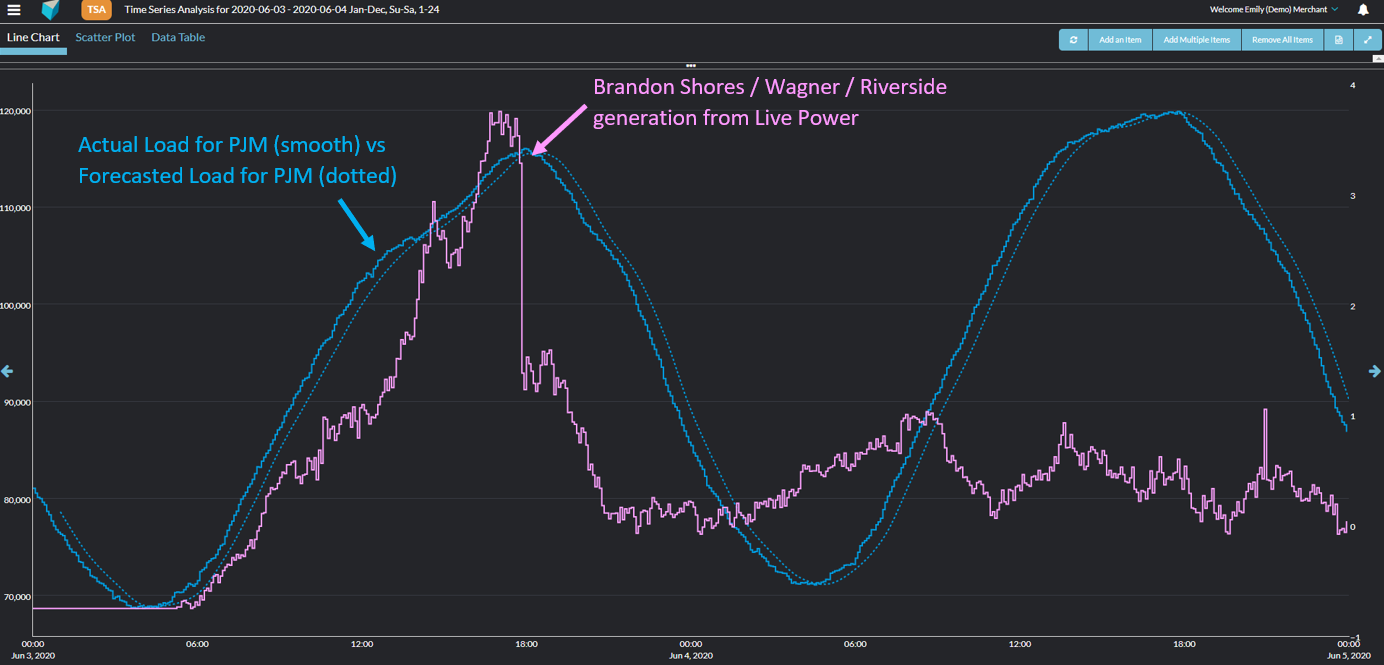
Let’s dig into what was happening on the grid at this time. Below, we can see that on 6/3, the actual load for PJM came in a bit higher than forecasted. We can also see that this appears to correlate with Brandon Shores / Wagner / Riverside ramping up to meet the additional load.

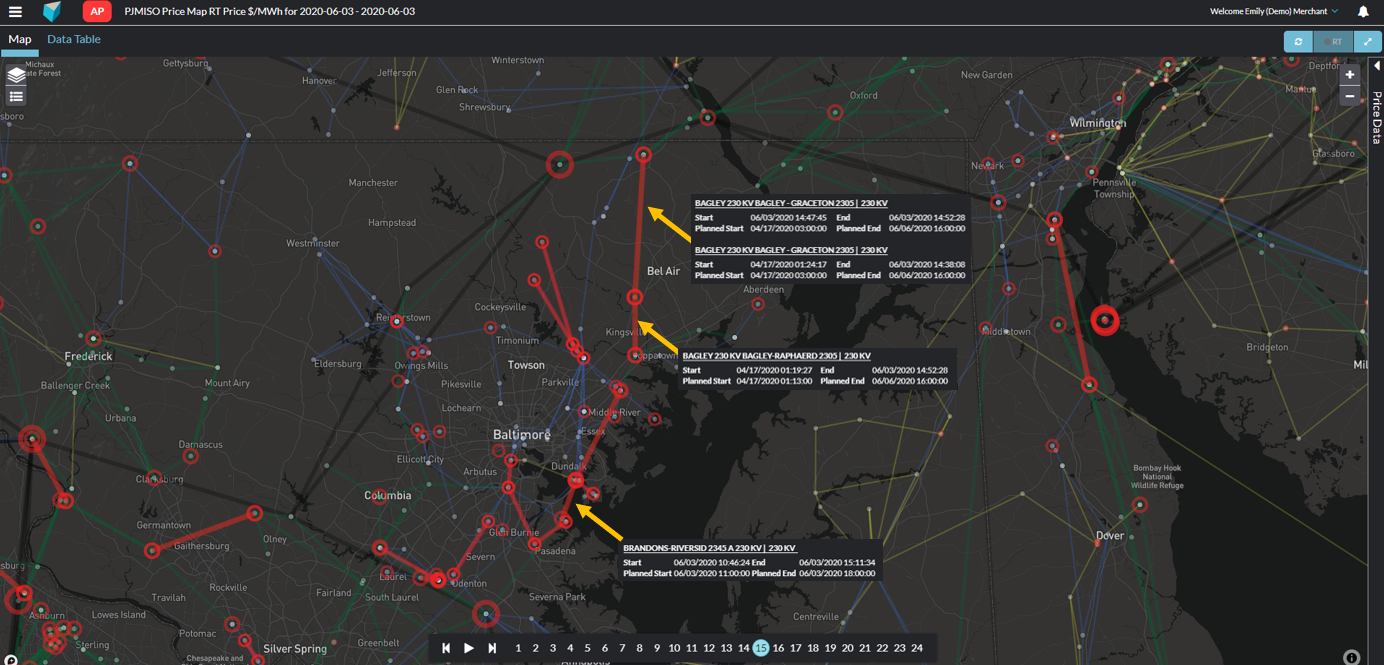
Let’s look at the Analytic Price Map module to see if any transmission outages were active in the area and ended around the time that Brandon Shores / Wagner / Riverside tripped offline, which may have exacerbated the problem. Below we can see that the following nearby transmission lines all came back online around the time of the plant trip: BAGLEY-GRACETON 230 KV 2305, BAGLEY-RAPHAERD 230 KV 2305, and BRANDONS-RIVERSID 2345 A 230 KV. This likely did exacerbate the impact of Brandon Shores / Wagner / Riverside tripping offline.

Next let’s look at the Constraint Summary module to see which constraints were binding mid-day on 6/3 when load came in higher than forecasted and Brandon Shores / Wagner / Riverside tripped offline.
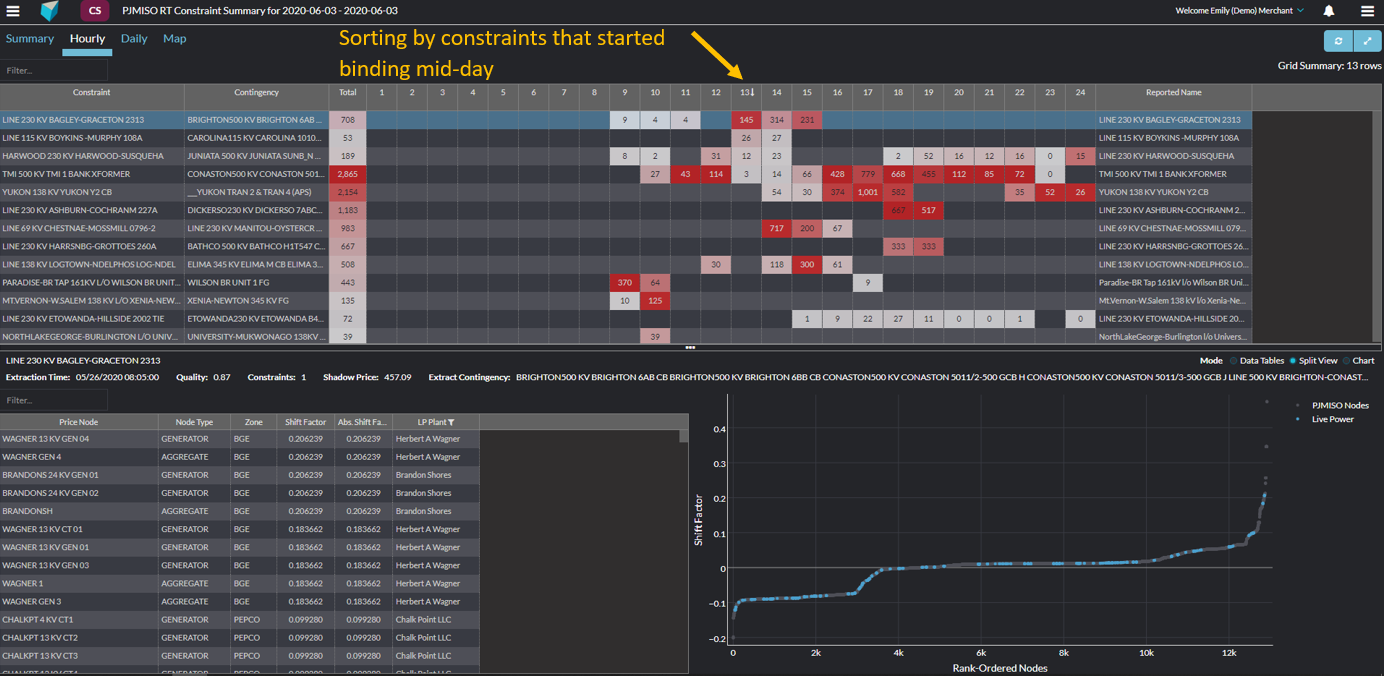

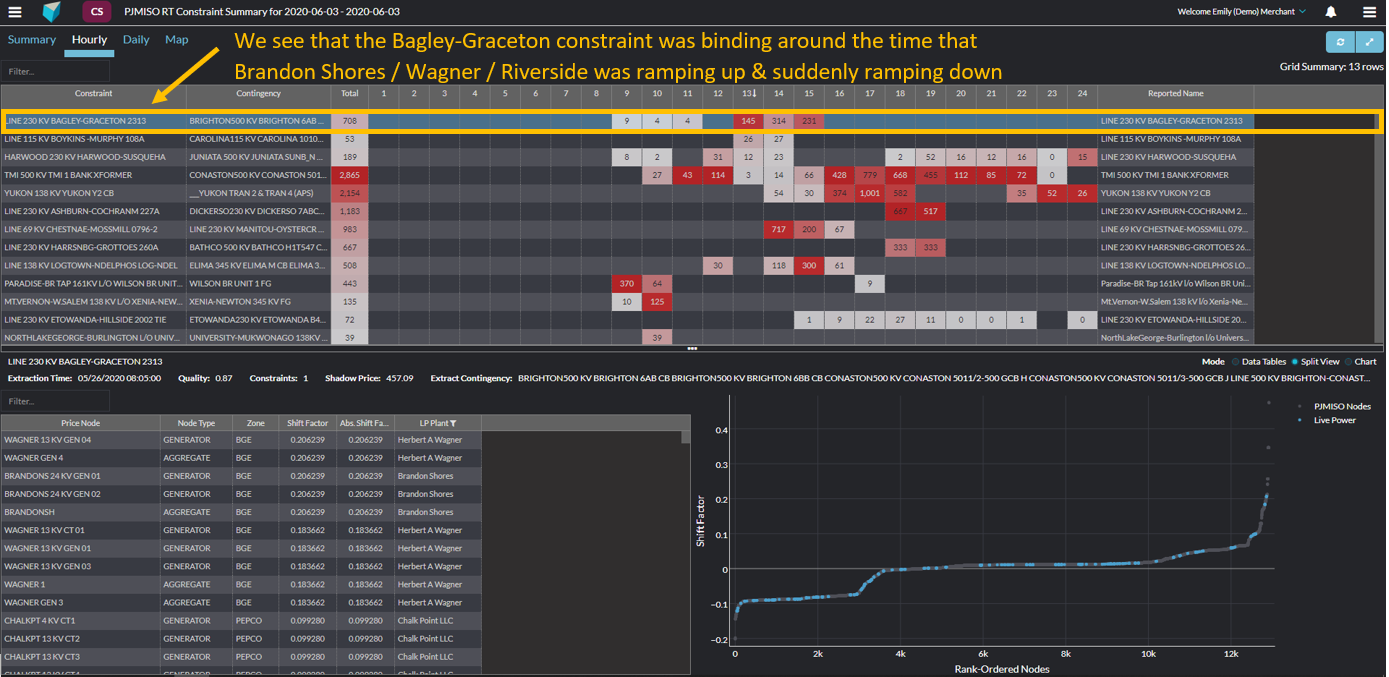
The Bagley-Graceton constraint started binding around the time that Brandon Shores / Wagner / Riverside was ramping up mid-day on 6/3.

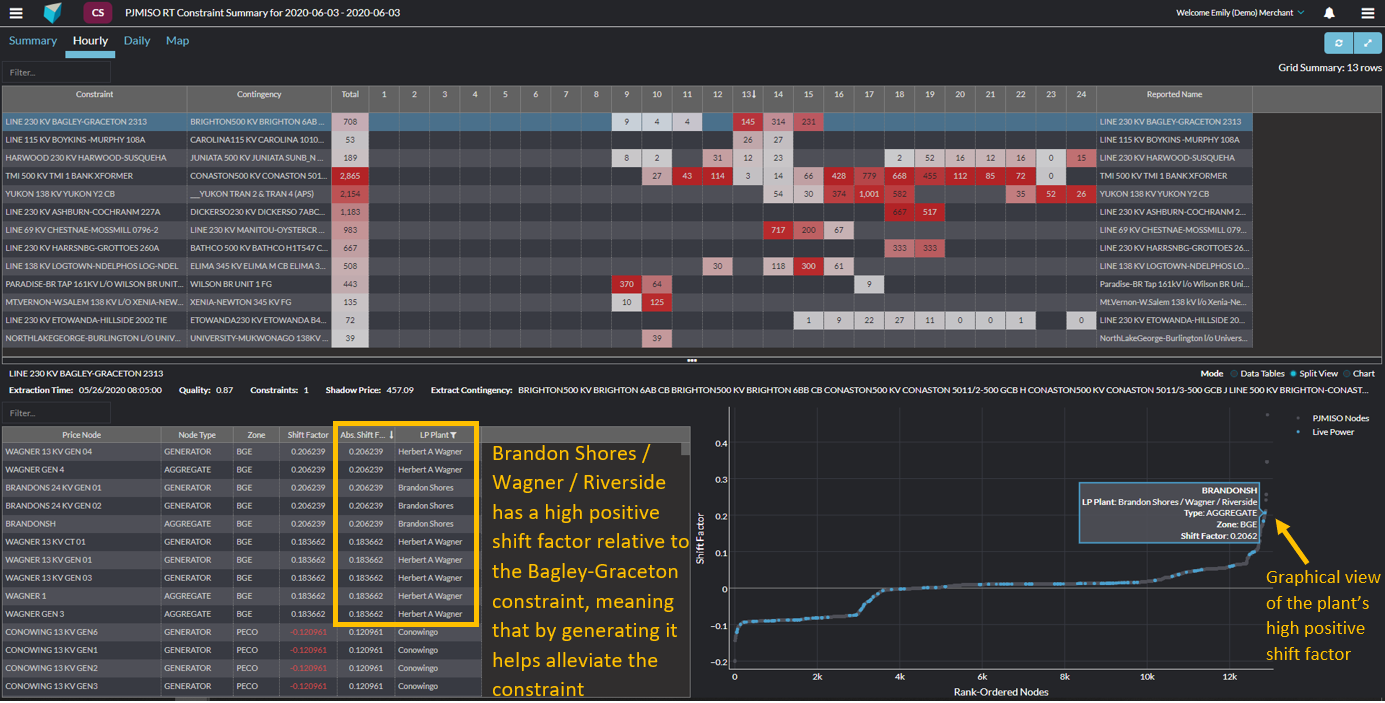
If we sort the shift factors high to low we can see that Brandon Shores / Wagner / Riverside has a high positive shift factor relative to the Bagley-Graceton constraint, meaning that it can help alleviate the congestion by generating.

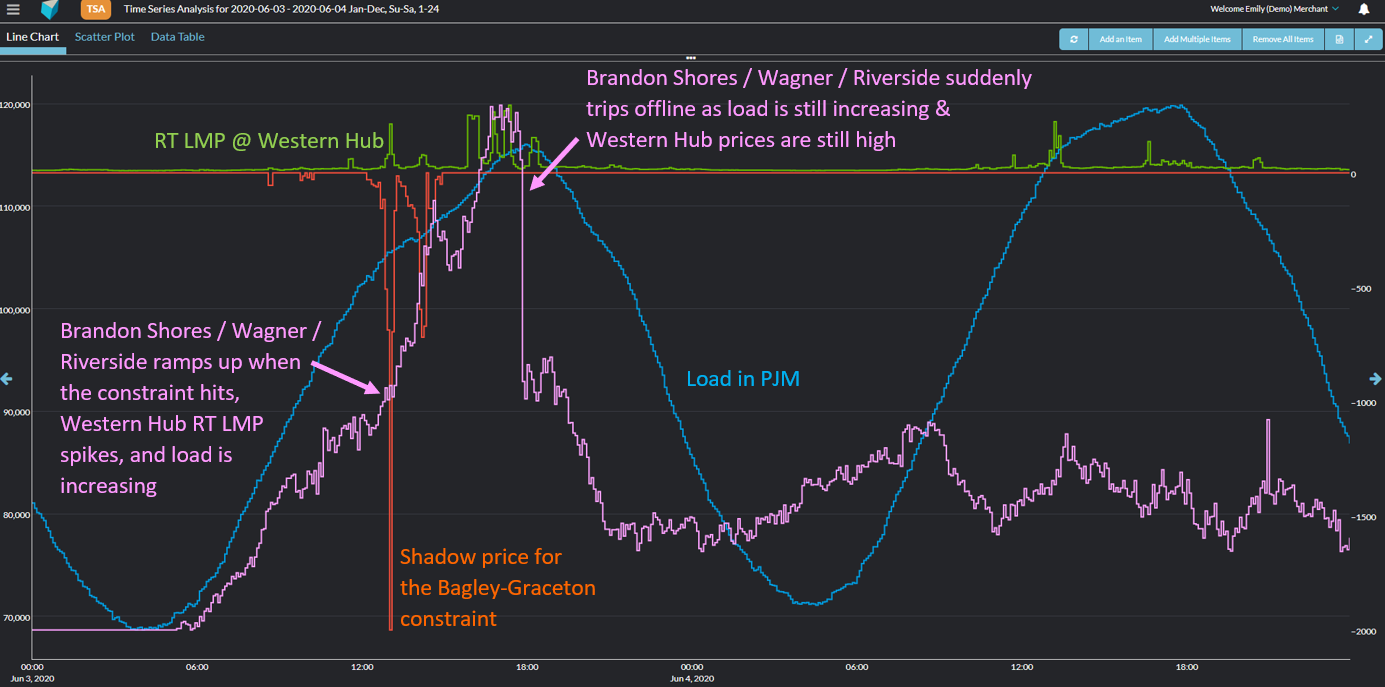
Let’s dive into Time Series Analysis to see how Brandon Shores / Wagner / Riverside reacted to the Bagley-Graceton constraint binding. Did it ramp up like it should have?
Here we can see that Brandon Shores / Wagner / Riverside started ramping up when the Bagley-Graceton constraint bound, however it suddenly tripped offline at 17:49 when load was still increasing and Western Hub prices were still high, which seems to have resulted in a second spike in price at Western Hub.

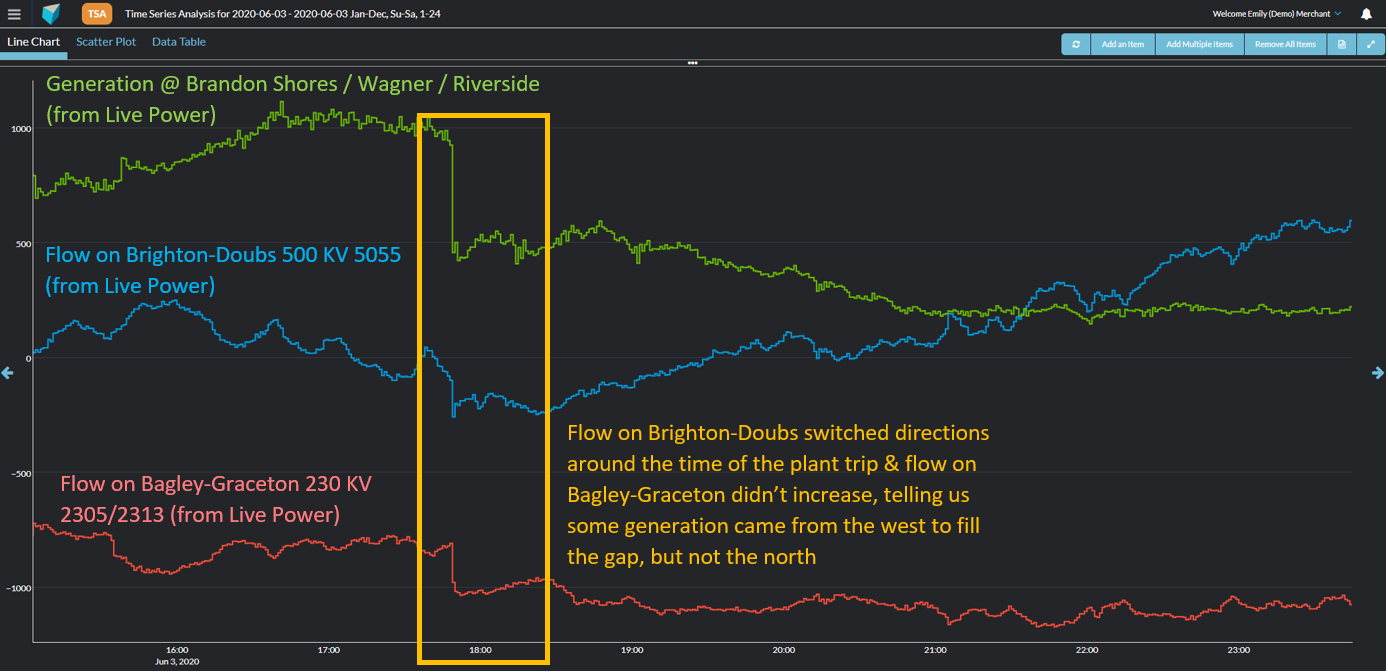
Let’s look to see how generators in the area responded to Brandon Shores / Wagner / Riverside suddenly tripping offline. One way to do that is by looking at line flows - did flow switch direction on any nearby lines or did flows suddenly increase? As seen below, flow on Brighton-Doubs switched directions around the time of the plant trip & flow on Bagley-Graceton didn’t increase, telling us some generation came from the west to fill the gap, but not the north.

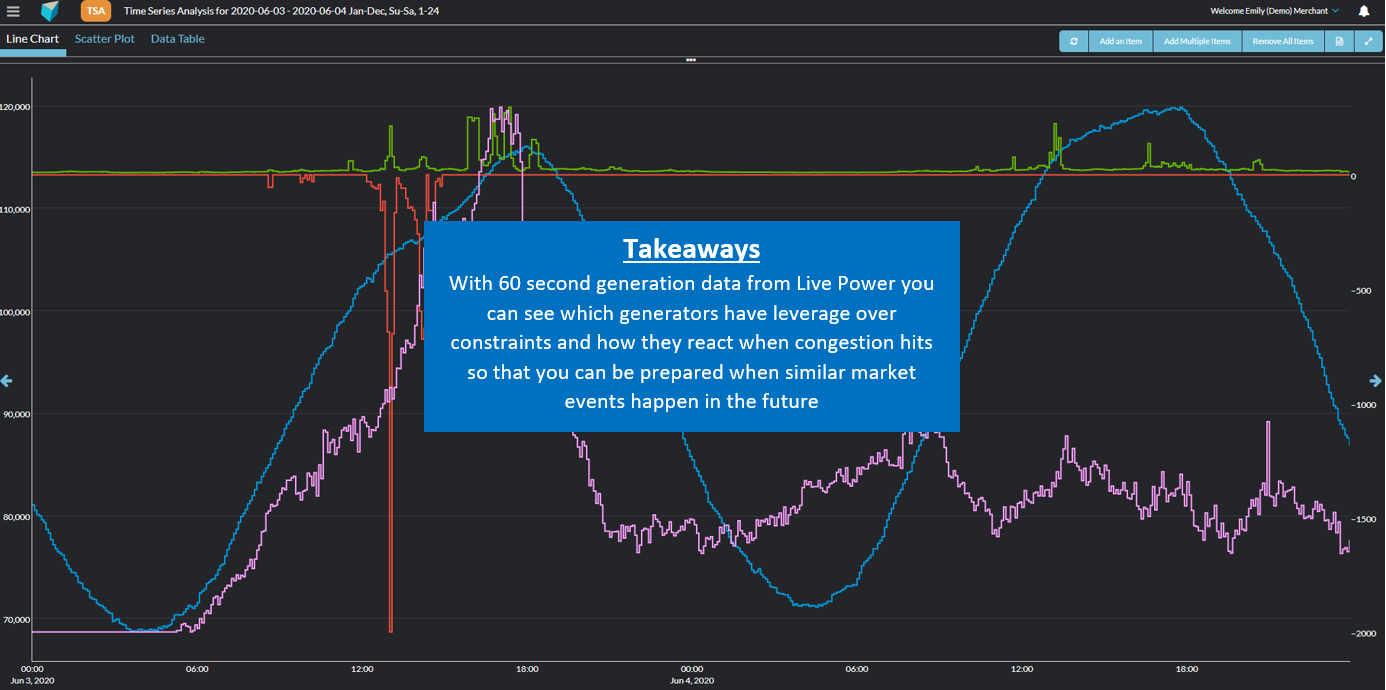
In summary, Live Power data, alongside Yes Energy market data (transmission outages, shift factors, prices, load, constraints) helps you understand the impact of generation on constraints as plants respond (or don’t) during congestion. This allows you to be better prepared in the future when similar market events occur.

Learn more about the data used in this analysis!