


Share this
by Max Lotspeich on Aug 28, 2020
“If you’re trading Bal-Day in ERCOT, you need Live Power”. We are hearing this from our partner Live Power’s customers more and more frequently. In today’s market conditions, you can’t trade with blinders on and you shouldn’t settle for data that is posted less frequently than every 60 seconds.
The week of August 10th, 2020 presents a great case study of why Live Power generation & transmission data in conjunction with Yes Energy market data is vital. That week was particularly volatile in ERCOT, resulting in the RT LMP at Hub North exceeding $800 on August 12th, August 14th, and August 15th. In this blog post we’ll drill into what happened on August 12th that caused the real time LMP at Hub North to reach $857 and why having real time generation & transmission data from Live Power alongside energy market data from Yes Energy allowed users to diagnose what happened so they could be prepared before prices spiked to $1,296 on August 14th and $2,444 on August 15th.
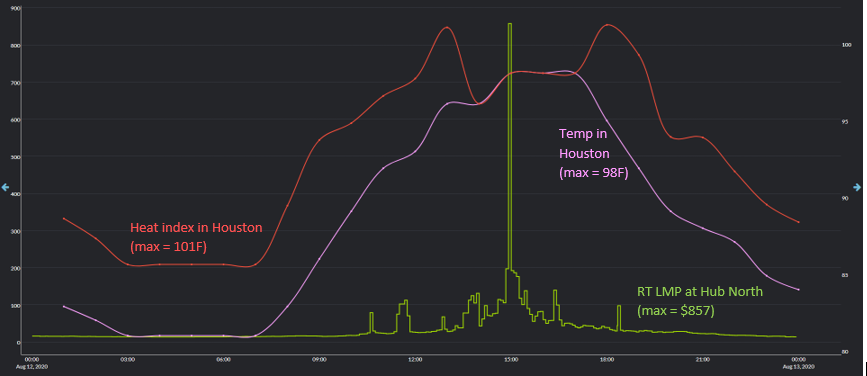
1. High temperatures & heat index: Throughout the week of August 10th, the temperature and heat index (which drives power demand) reached 100+ degrees Fahrenheit in Texas. As seen below, temperatures in the Houston area reached 98 degrees Fahrenheit and the heat index reached 101 degrees Fahrenheit on August 12th (source: NWS).

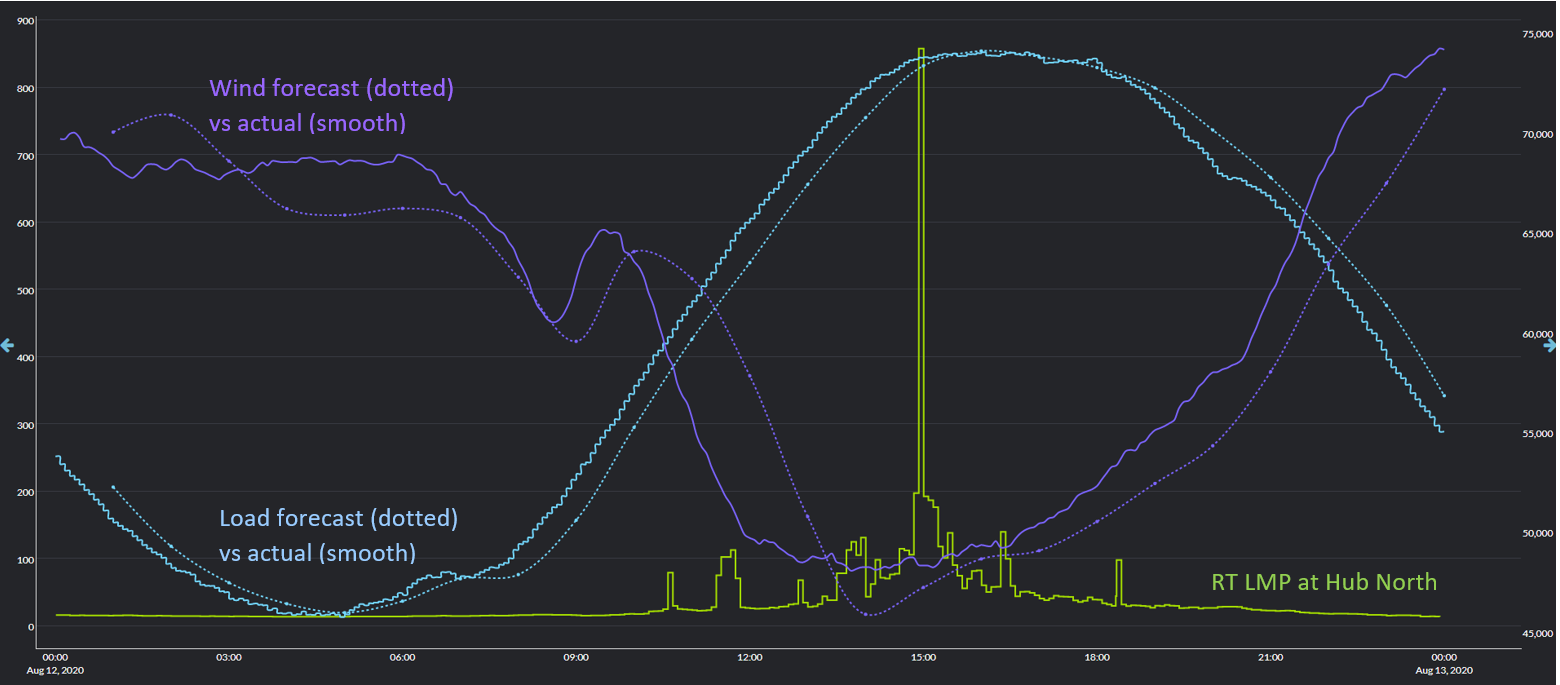
2. Load & wind forecast error: With high temperatures often comes high load, which was the case on August 12th. As seen below, the load forecast (dotted blue line) came in lower than forecasted (solid blue line) between 7 am CT and 3:30 pm CT, which overlaps with when prices started to spike. Not only did load come in higher than forecasted, but wind came in lower than forecasted during this same time period, which likely further worsened the problem. You can see that below by comparing the forecasted wind generation for ERCOT (dotted purple line) against the actual wind generation in ERCOT (smooth purple line). When prices were high on August 12th the load forecast error was around -1,500 MW and the wind forecast error was around 3,000 MW. Load coming in higher than forecasted and wind coming in lower than forecasted were likely key contributors to the price volatility.

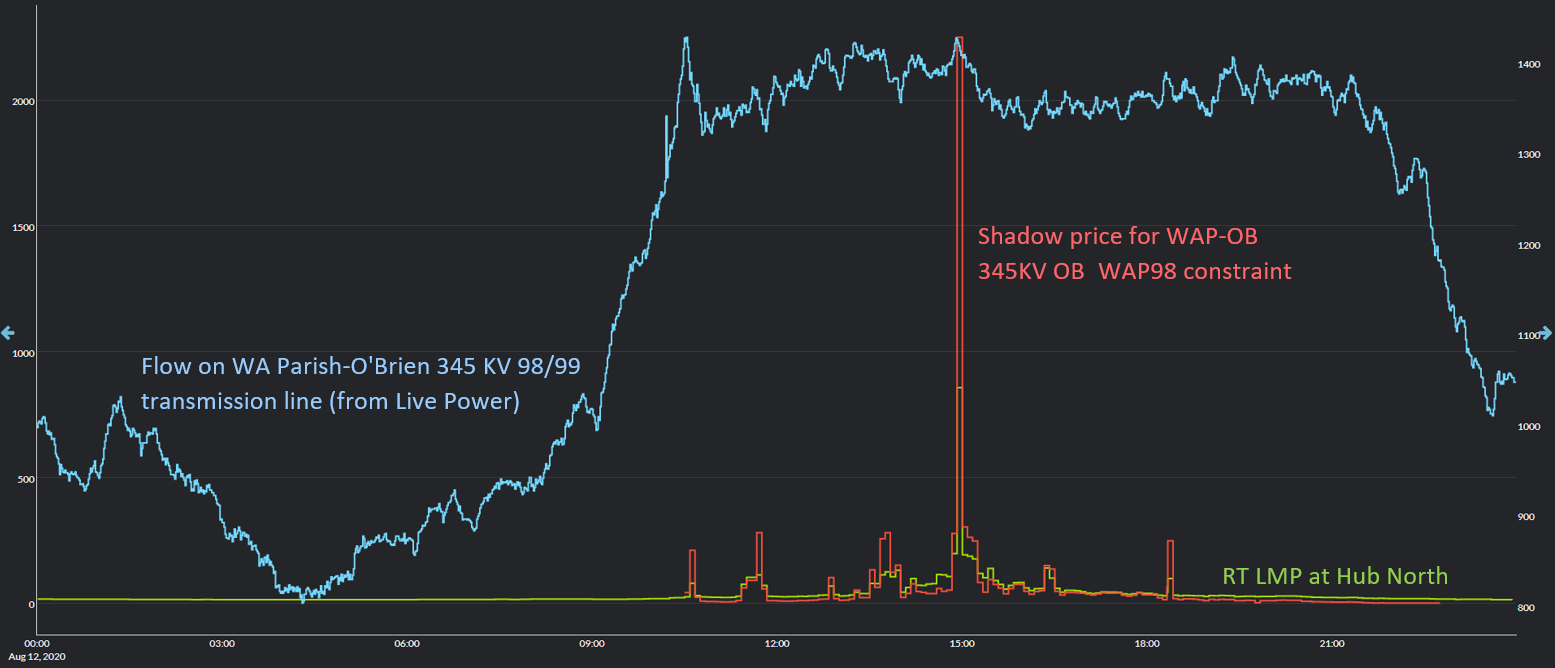
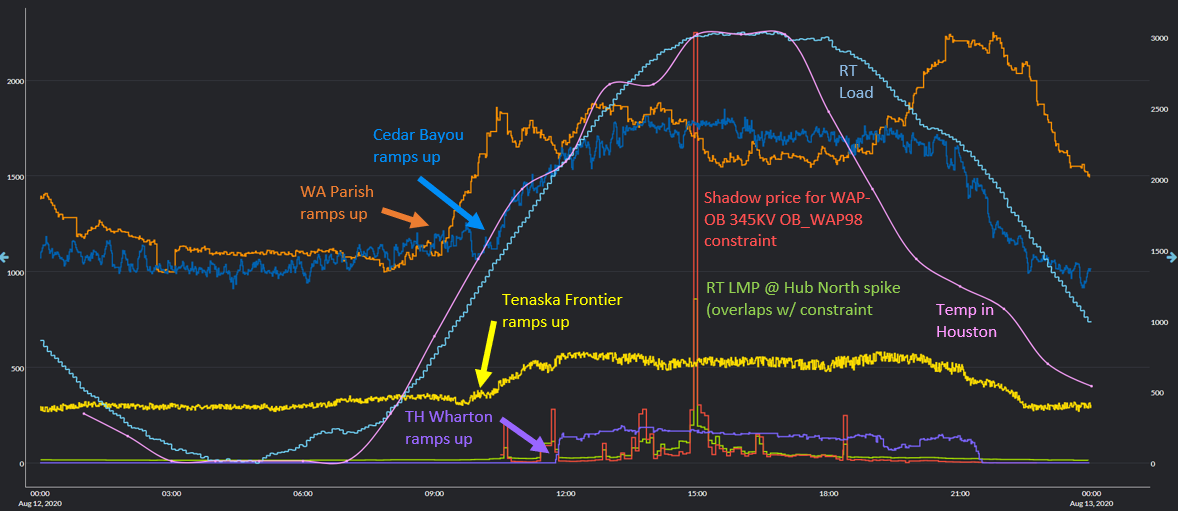
3. Congestion: Increased load on August 12th resulted in congestion on the transmission system. As seen below, the WA Parish-O'Brien 345 KV 98 line bound over the same time period there were price spikes around Hub North. Note, Live Power monitors WA Parish-O'Brien 345 KV 98/99, which is made up of WA Parish-O'Brien 345 KV 98 and WA Parish-O'Brien 345 KV 99. You can see below that there is a coinciding increase in flow on WA Parish-O'Brien 345 KV 98/99 (the blue line) when the constraint binds (red line).

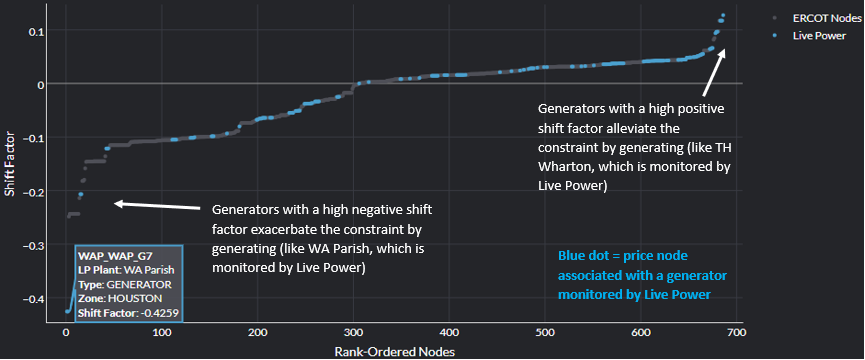
The graph below shows the shift factors for all of the price nodes impacted by the WAP-OB 345KV OB_WAP98 transmission constraint. Blue dots are price nodes associated with a Live Power monitored generator. Generators with a high positive shift have leverage over the constraint, meaning by generating they help alleviate the congestion (e.g., TH Wharton, which is monitored by Live Power). Conversely, generators with a high negative shift factor exacerbate the constraint by generating (e.g., WA Parish, which is monitored by Live Power). If you subscribe to Live Power you can see exactly how these generators respond when the constraint hits so you can be better prepared in the future when this constraint binds.

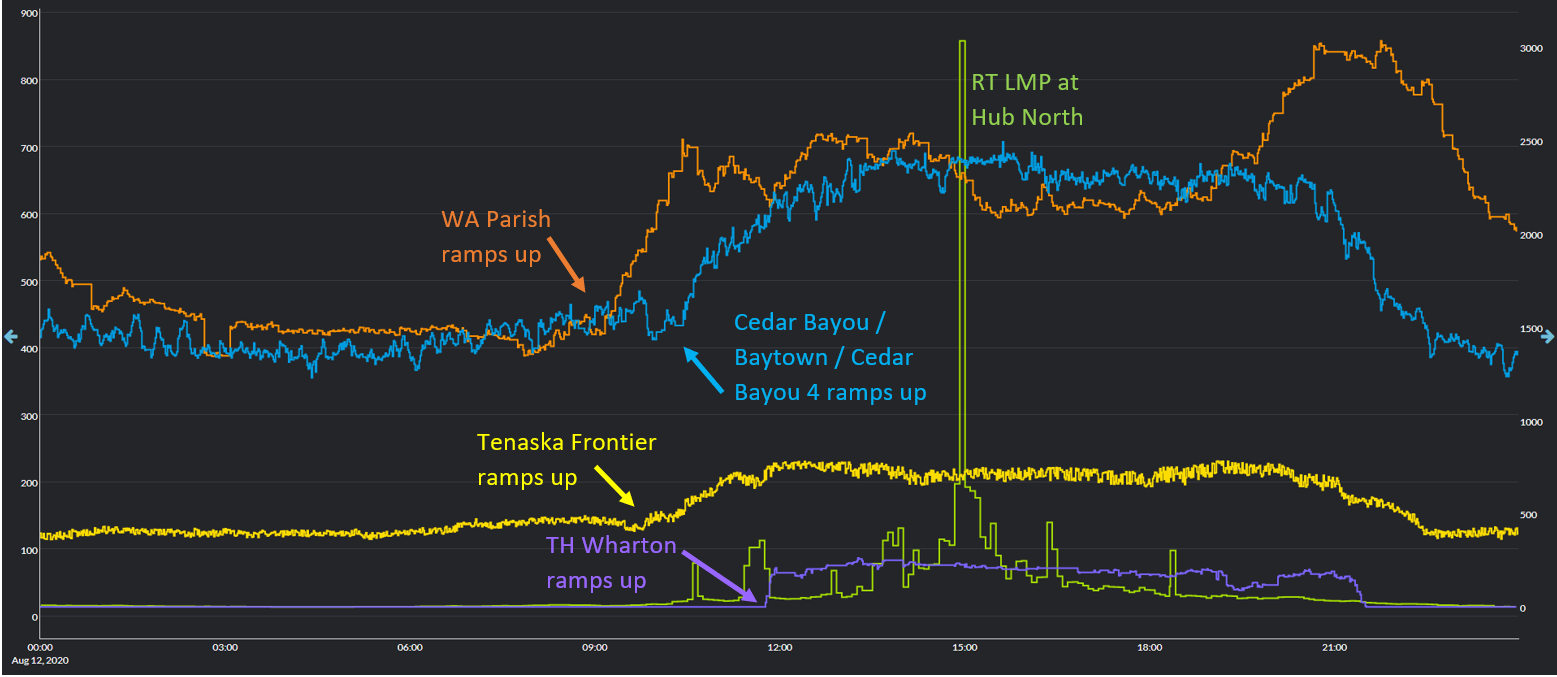
4. Generation: Using 60 second generation data from Live Power you can see which generators ramped up to meet load and simultaneously contributed to congestion on the grid. As seen below, the following Live Power monitored generators ramped up to meet demand: TH Wharton, WA Parish, Tenaska Frontier, and Cedar Bayou / Baytown / Cedar Bayou 4. By having access to Live Power data in Yes Energy, you can use these facilities as a leading indicator of price movement and congestion on the grid.

Key Takeaways
In summary, there are many contributing factors to the volatility in ERCOT during the week of August 10th, 2020. Having access to real time generation & transmission data from Live Power, right alongside energy market data in Yes Energy is critical for understanding what contributes to high price spikes so that you can be prepared in the future (in this case it was merely two days later). Sign up below for more information about the data used in this analysis and how it could benefit your workflow.

Sign up to learn more about the data used in this analysis!

