Share this
by Sarah Hatch on Aug 30, 2019
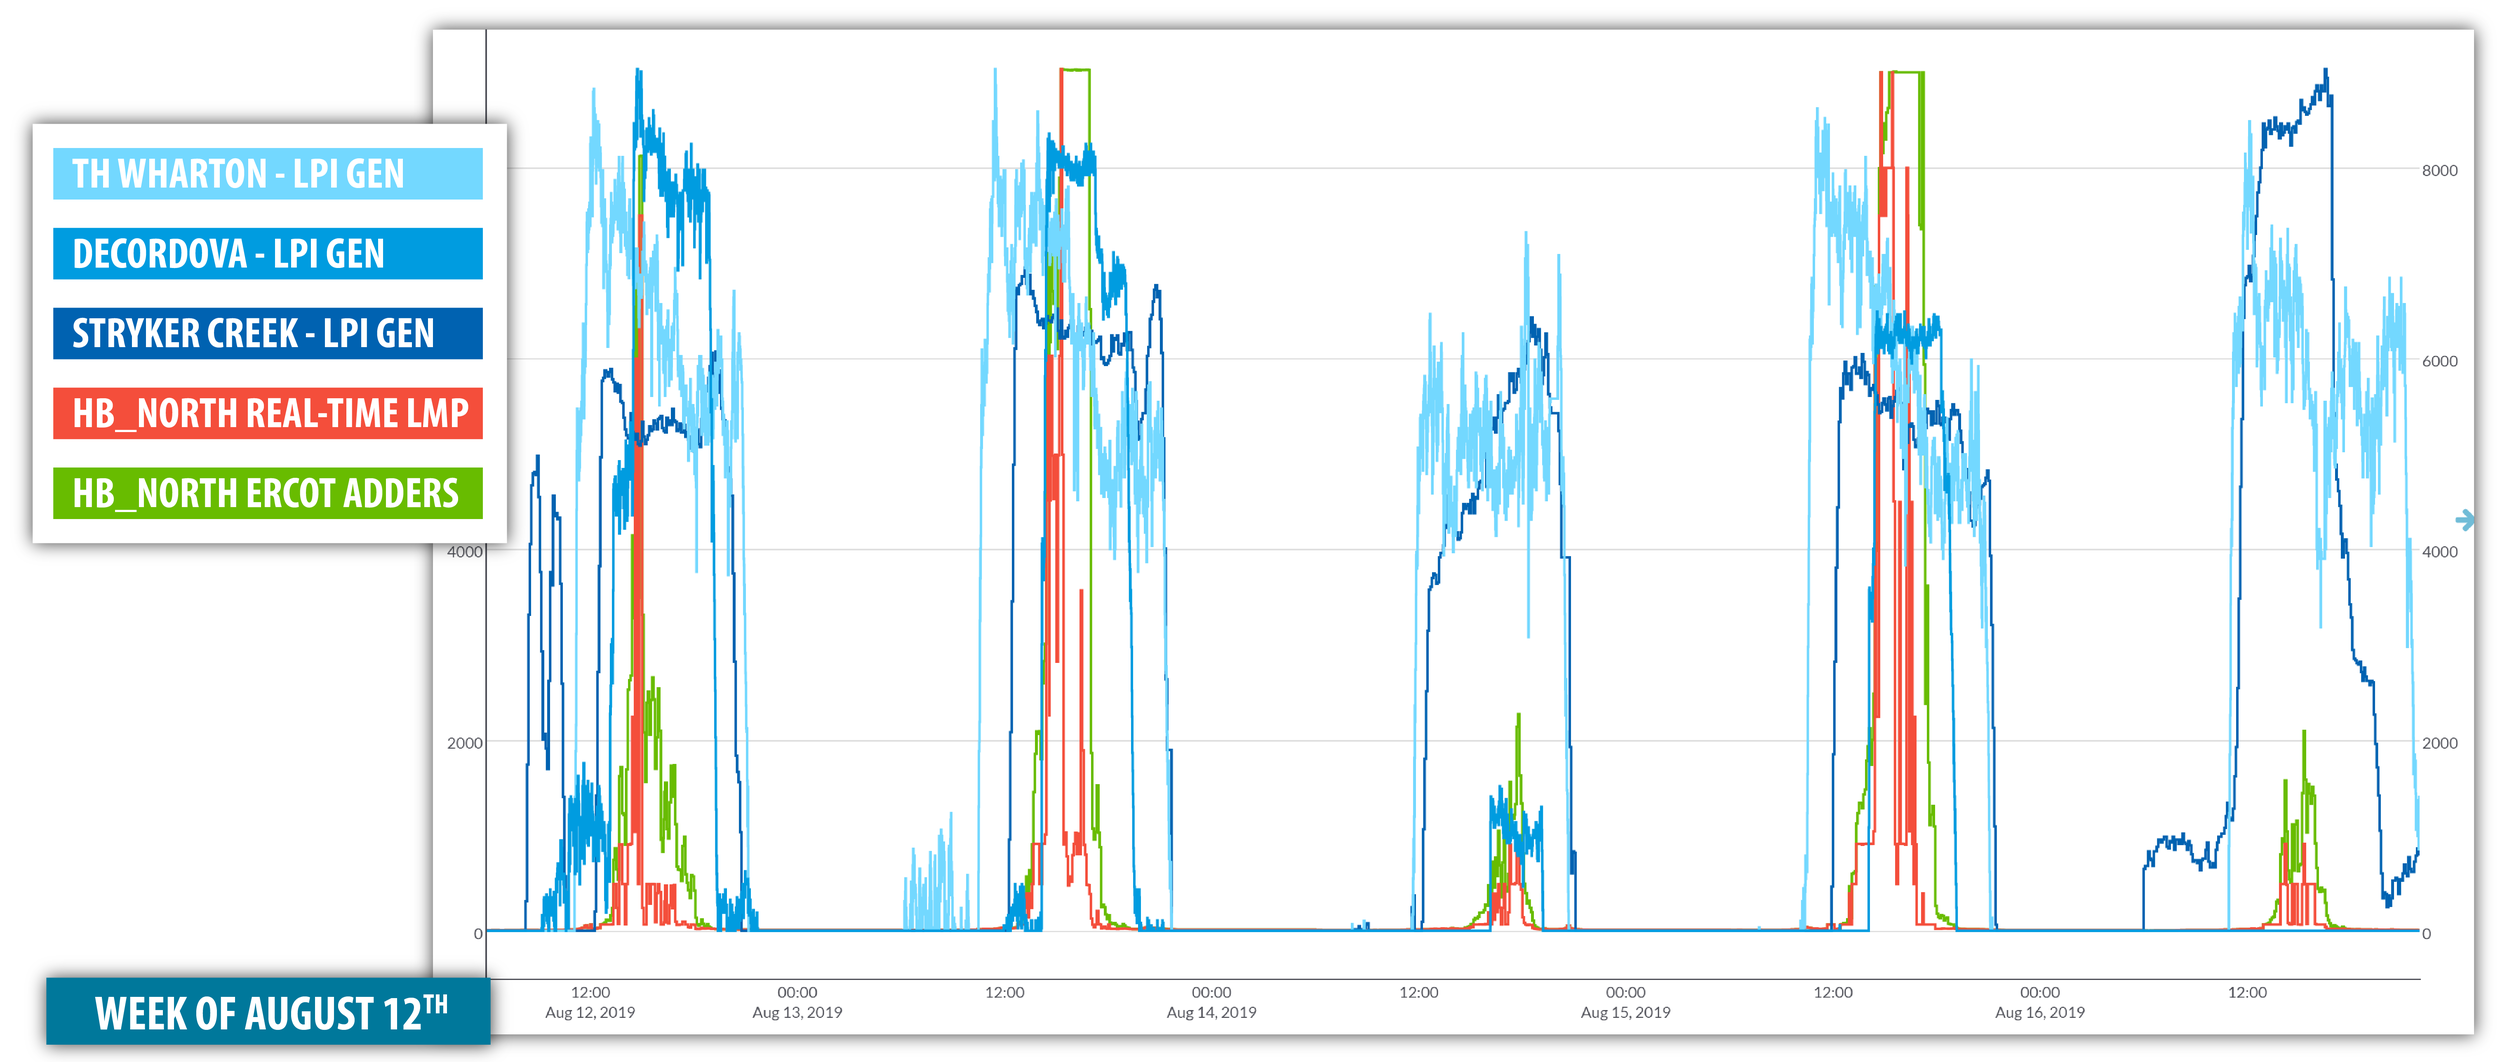
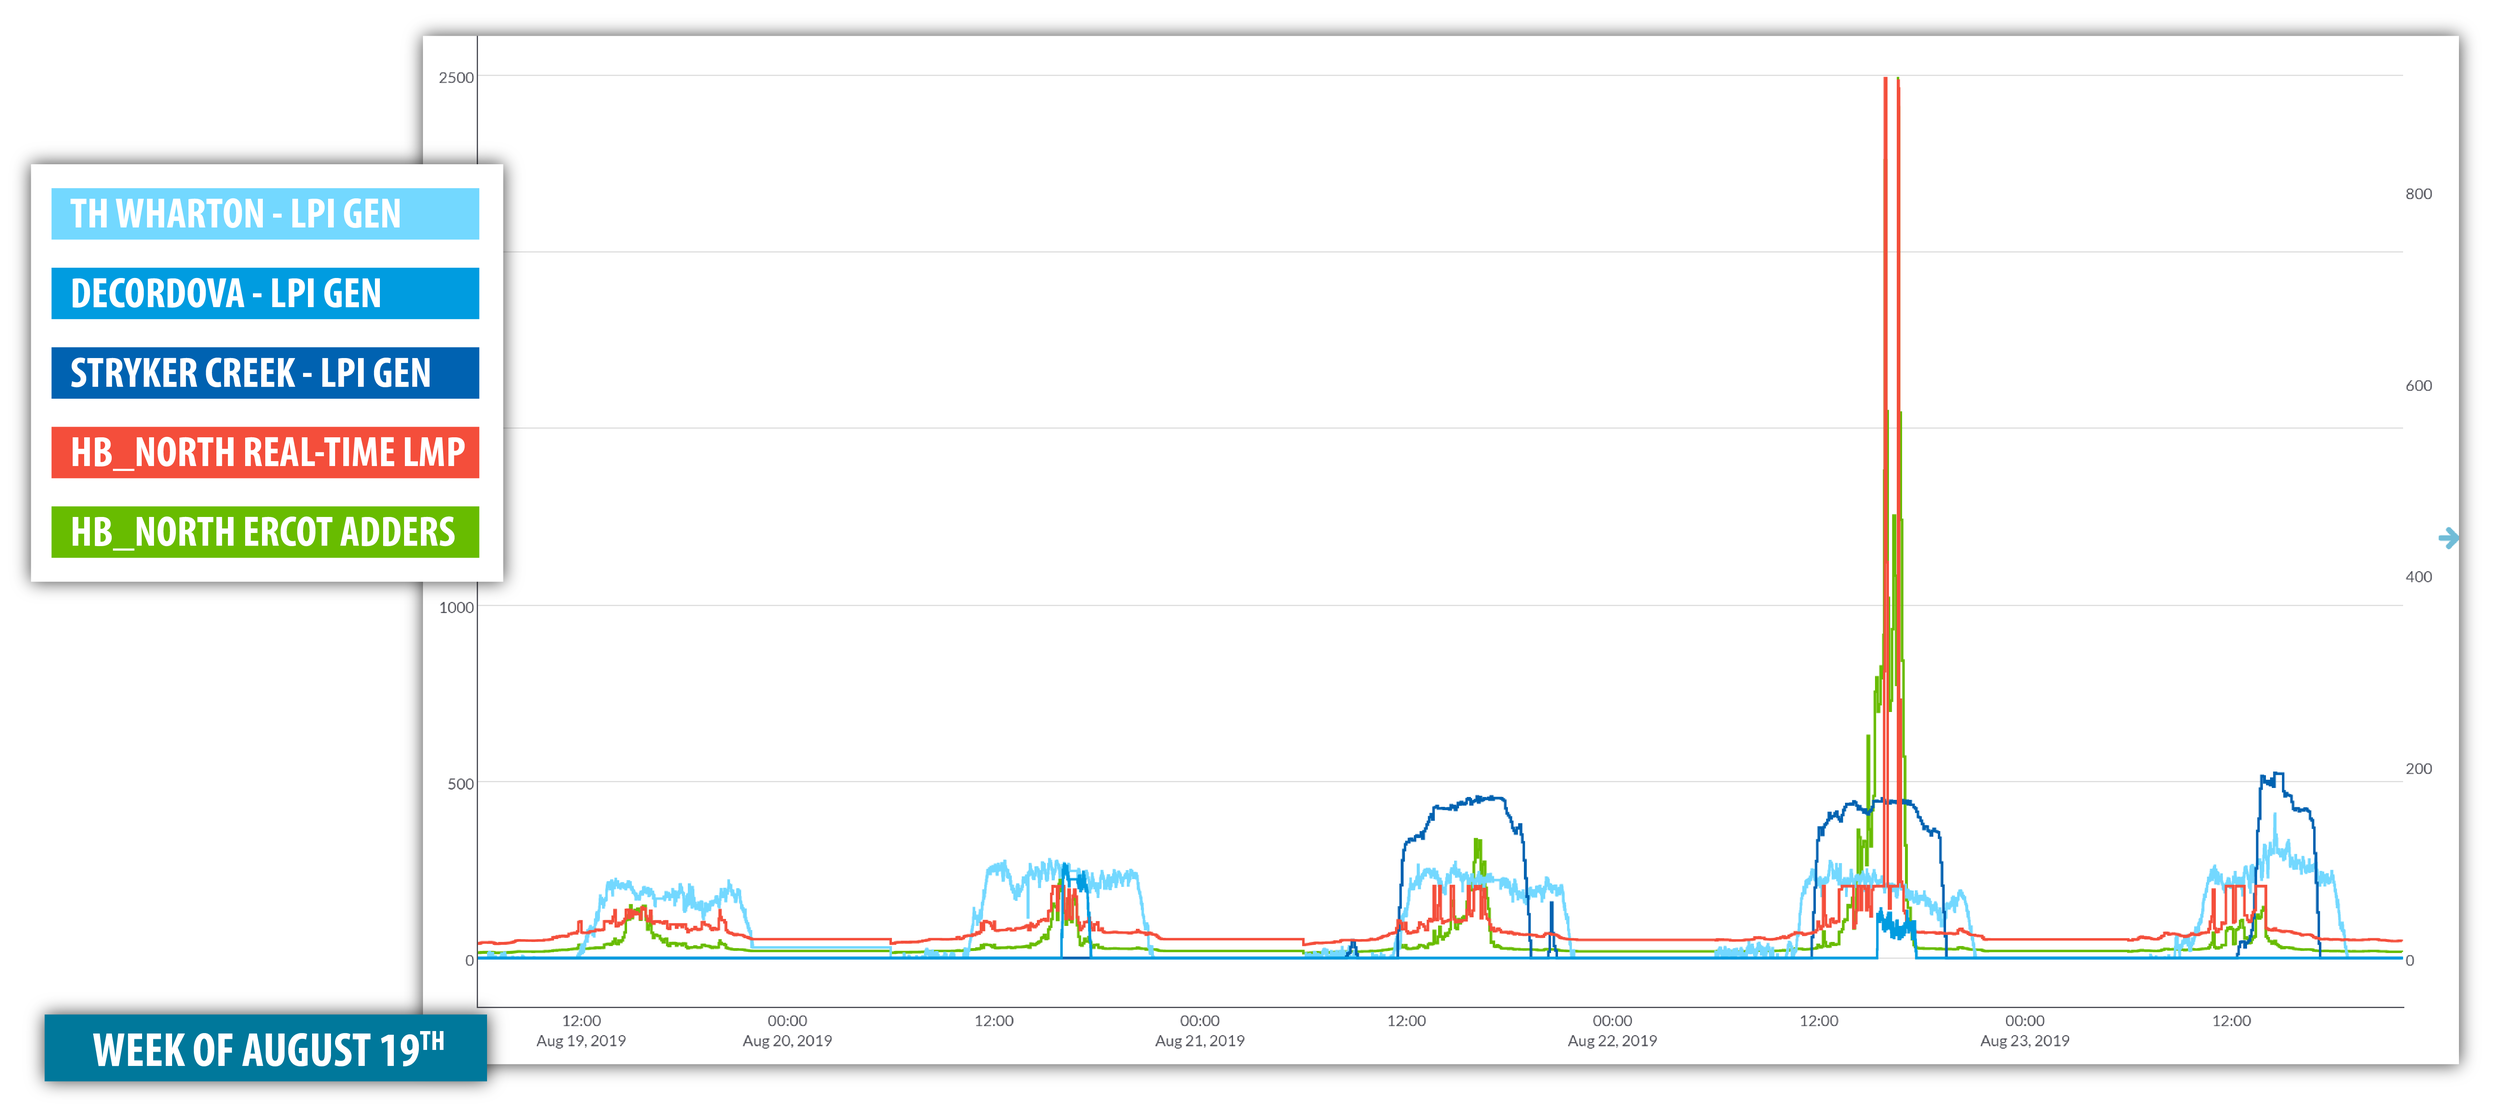
The last few weeks of August have been a roller coaster in ERCOT. The ISO issued two Energy Emergency Alerts (EEA1) after not issuing one for nearly five years. The week of August 12th RT prices at North Hub printed over $8,000 three days and on peak prices averaged over $1500 two days. The week of August 19th was mostly quiet, but Thursday saw a few $2000-plus prints. We looked at how to predict this market volatility using Live Power and other market data accessible in the Yes Energy product suite.
Using Live Power Data to Predict Market Volatility
Using Live Power data and the results of our previous analysis, a pattern emerged that helps us predict the timing of large price spikes. T.H. Wharton consistently ramps several hours before the largest prints. Stryker Creek and DeCordova ramp much closer to the price blowouts. DeCordova has been a particularly strong indicator. During the wild week of August 12th there were two days when prices peaked at ‘only’ $2,000. On those days DeCordova ramped to less than 10% of capacity.

The week of August 19th ERCOT was quieter, but Stryker Creek and DeCordova remained a strong signal. Strkyer Creek was off Monday and Tuesday when the highest prints were in the $200-$250 range. DeCordova was off Wednesday and Friday. The only day they both ramped was Thursday when we saw those $2,000 prints. These plants will be ones to watch through late summer in ERCOT.

Using Other Market Data to Signal When ERCOT Market Volatility Will Occur
Individual pieces of market data such as Load, Wind, and Reserve Indicators including Capacity Available to Increase SCED (Cap Inc. SCED) can all be useful in alerting market participants when the ERCOT market is getting tight and prices may be about to rise, see the below chart from the week of August 12.
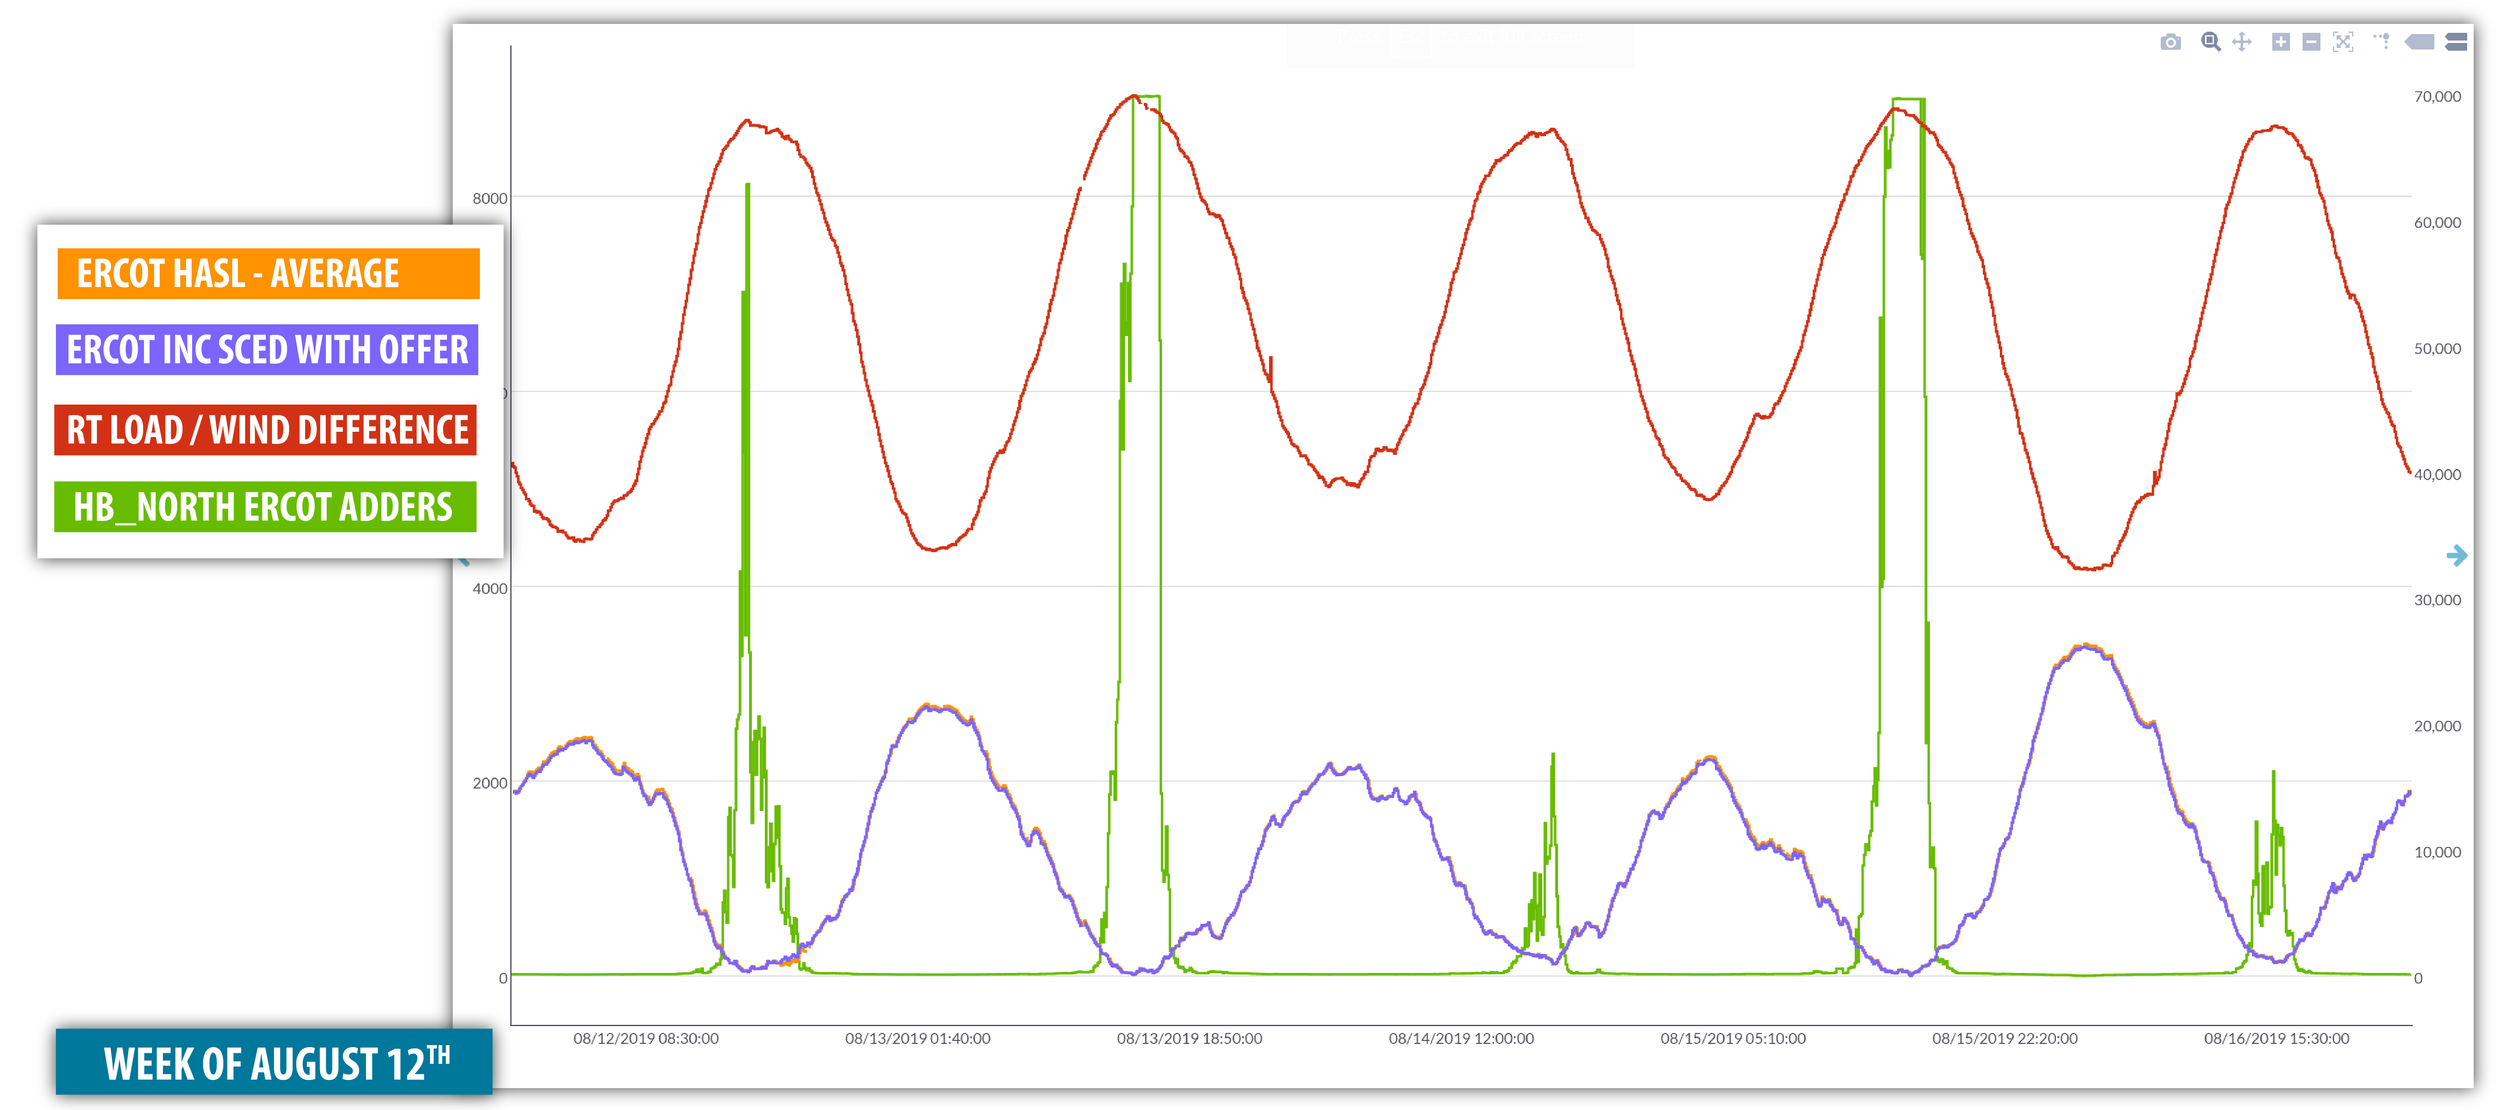

*ERCOT HASL - The maximum capacity a Generation Resource may be dispatched while maintaining its scheduled ancillary services. Calculated as the High Sustained Limit (HSL) minus the Ancillary Service Schedules for Responsive & Non-spin minus Ancillary Services Responsibility for Reg-up.
However you can create even more intelligent signals using our Formula Series and Multi Conditional Alerting capabilities in Quicksignals.
Instead of keeping an eye on Load, Wind, and Cap Inc. SCED separately, we can create a custom data series of Load-Wind in Formula Series and then using our Multi-Conditional alert functionality, set up the alert (detailed below*) that will let you know every time the market is getting tight in ERCOT and North Hub prices are about to rise.
*Multi-Conditional Alert Settings:
Condition 1: Load - Wind > 62,000 MW
Condition 2: Cap Inc. SCED < 2,800 MW
Want to see more of this type of analysis? Sign up for a demo!